
 Bitcoin
  Ethereum
  Tether
  BNB
BNB  USDC
USDC  XRP
XRP  Solana
  TRON
TRON  Figure Heloc
  Hyperliquid
  Dogecoin
  USDS
USDS  LEO Token
  Wrapped stETH
  Zcash
Zcash  Stellar
  Wrapped Bitcoin
  WhiteBIT Coin
  Binance Bridged USDT (BNB Smart Chain)
  Cardano
  Canton
  Wrapped eETH
  Bitcoin Cash
  USD1
USD1  sUSDS
sUSDS  Ethena USDe
  Coinbase Wrapped BTC
  Litecoin
  Hedera
  Circle USYC
  WETH
WETH  Sui
Sui  Global Dollar
  Avalanche
  USDT0
USDT0  NEAR Protocol
  Shiba Inu
  BlackRock USD Institutional Digital Liquidity Fund
  Ondo US Dollar Yield
  Ethena Staked USDe
  Bittensor
  MemeCore
  LAB
LAB  PAX Gold
  World Liberty Financial
  Aster
Aster  OKB
OKB  Ondo
Ondo  Ripple USD
  HTX DAO
  syrupUSDC
  Worldcoin
  Polkadot
  Falcon USD
  USDD
USDD  Aave
Aave  Sky
Sky  BFUSD
BFUSD  Pi Network
  Pepe
Pepe  Jupiter Perpetuals Liquidity Provider Token
  Quant
Quant  Spiko EU T-Bills Money Market Fund
  KuCoin
  Jito Staked SOL
  USDGO
USDGO  Janus Henderson Anemoy Treasury Fund
  Stable
  Audiera
  Binance-Peg WETH
  Rocket Pool ETH
  Render
  Binance Bridged USDC (BNB Smart Chain)
  Cosmos Hub
  Jupiter
  POL (ex-MATIC)
  Function FBTC
  Algorand
  NEXO
NEXO  JUST
JUST  Ethena
  USDtb
USDtb  syrupUSDT
  ADI
ADI  Gate
Gate  Beldex
  Binance Staked SOL
  币安人生 (BinanceLife)
  Janus Henderson Anemoy AAA CLO Fund
  Spiko Amundi Overnight Swap Fund (EUR)
  Pump.fun
  Venice Token
  Filecoin
  NEW X CEO IS BACK
  Polygon Bridged USDC (Polygon PoS)
  Solv Protocol BTC
  Flare
Flare  Usual USD
  YLDS
YLDS  clBTC
clBTC  Midnight
  Lighter
  Aerodrome Finance
  Aptos
Aptos  StakeWise Staked ETH
  Arbitrum
  TrueUSD
  Kinetiq Staked HYPE
  A7A5
A7A5  tBTC
tBTC  Injective
  EURC
EURC  Pudgy Penguins
  Artificial Superintelligence Alliance
  Official Trump
  c8ntinuum
  Ondo Short-Term U.S. Government Bond Fund
  Mantle Staked Ether
  VeChain
  Hastra PRIME
  Polygon PoS Bridged DAI (Polygon POS)
  Bonk
Bonk  SPX6900
  COCA
COCA  Celestia
  Jito
Jito  Virtuals Protocol
  Liquid Staked ETH
  Grass
Grass  Arbitrum Bridged WBTC (Arbitrum One)
  Terra Luna Classic
  Ether.fi
  The9bit
  Wrapped Flare
  apxUSD
  Sun Token
  L2 Standard Bridged WETH (Base)
  Kinesis Gold
  Steakhouse USDC Morpho Vault
  Curve DAO
  Pyth Network
  ETHGas
  Plasma
  Binance-Peg XRP
  Bitcoin SV
  Ether.Fi Liquid ETH
  AINFT
AINFT  Noon
Noon  Jupiter Staked SOL
  Olympus
  Savings USDD
  Monad
Monad  BUILDon
  Unibase
  Marinade Staked SOL
  Conflux
This is a daily analysis of top tokens with CME futures by CoinDesk analyst and Chartered Market Technician Omkar Godbole.
XRP: Rally against BTC has likely just begun
XRP’s (XRP) dollar-denominated prices have surged nearly 60% to new lifetime highs above $3.50 this month. However, against bitcoin
, it appears to be on the verge of kickstarting a significant bull run, as evident from the chart below, which shows the prices for the Binance-listed XRP/BTC ratio.
As of writing, the ratio was probing the upper end of the four-year-long sideways channel that began in early 2021.
Much like coiled springs, sideways channels are periods of energy accumulation. This pent-up energy is eventually unleashed in a powerful directional move; typically, the longer the consolidation, the more substantial the eventual breakout.
Thus, a breakout in the XRP/BTC ratio could mean significant gains for XRP relative to bitcoin.
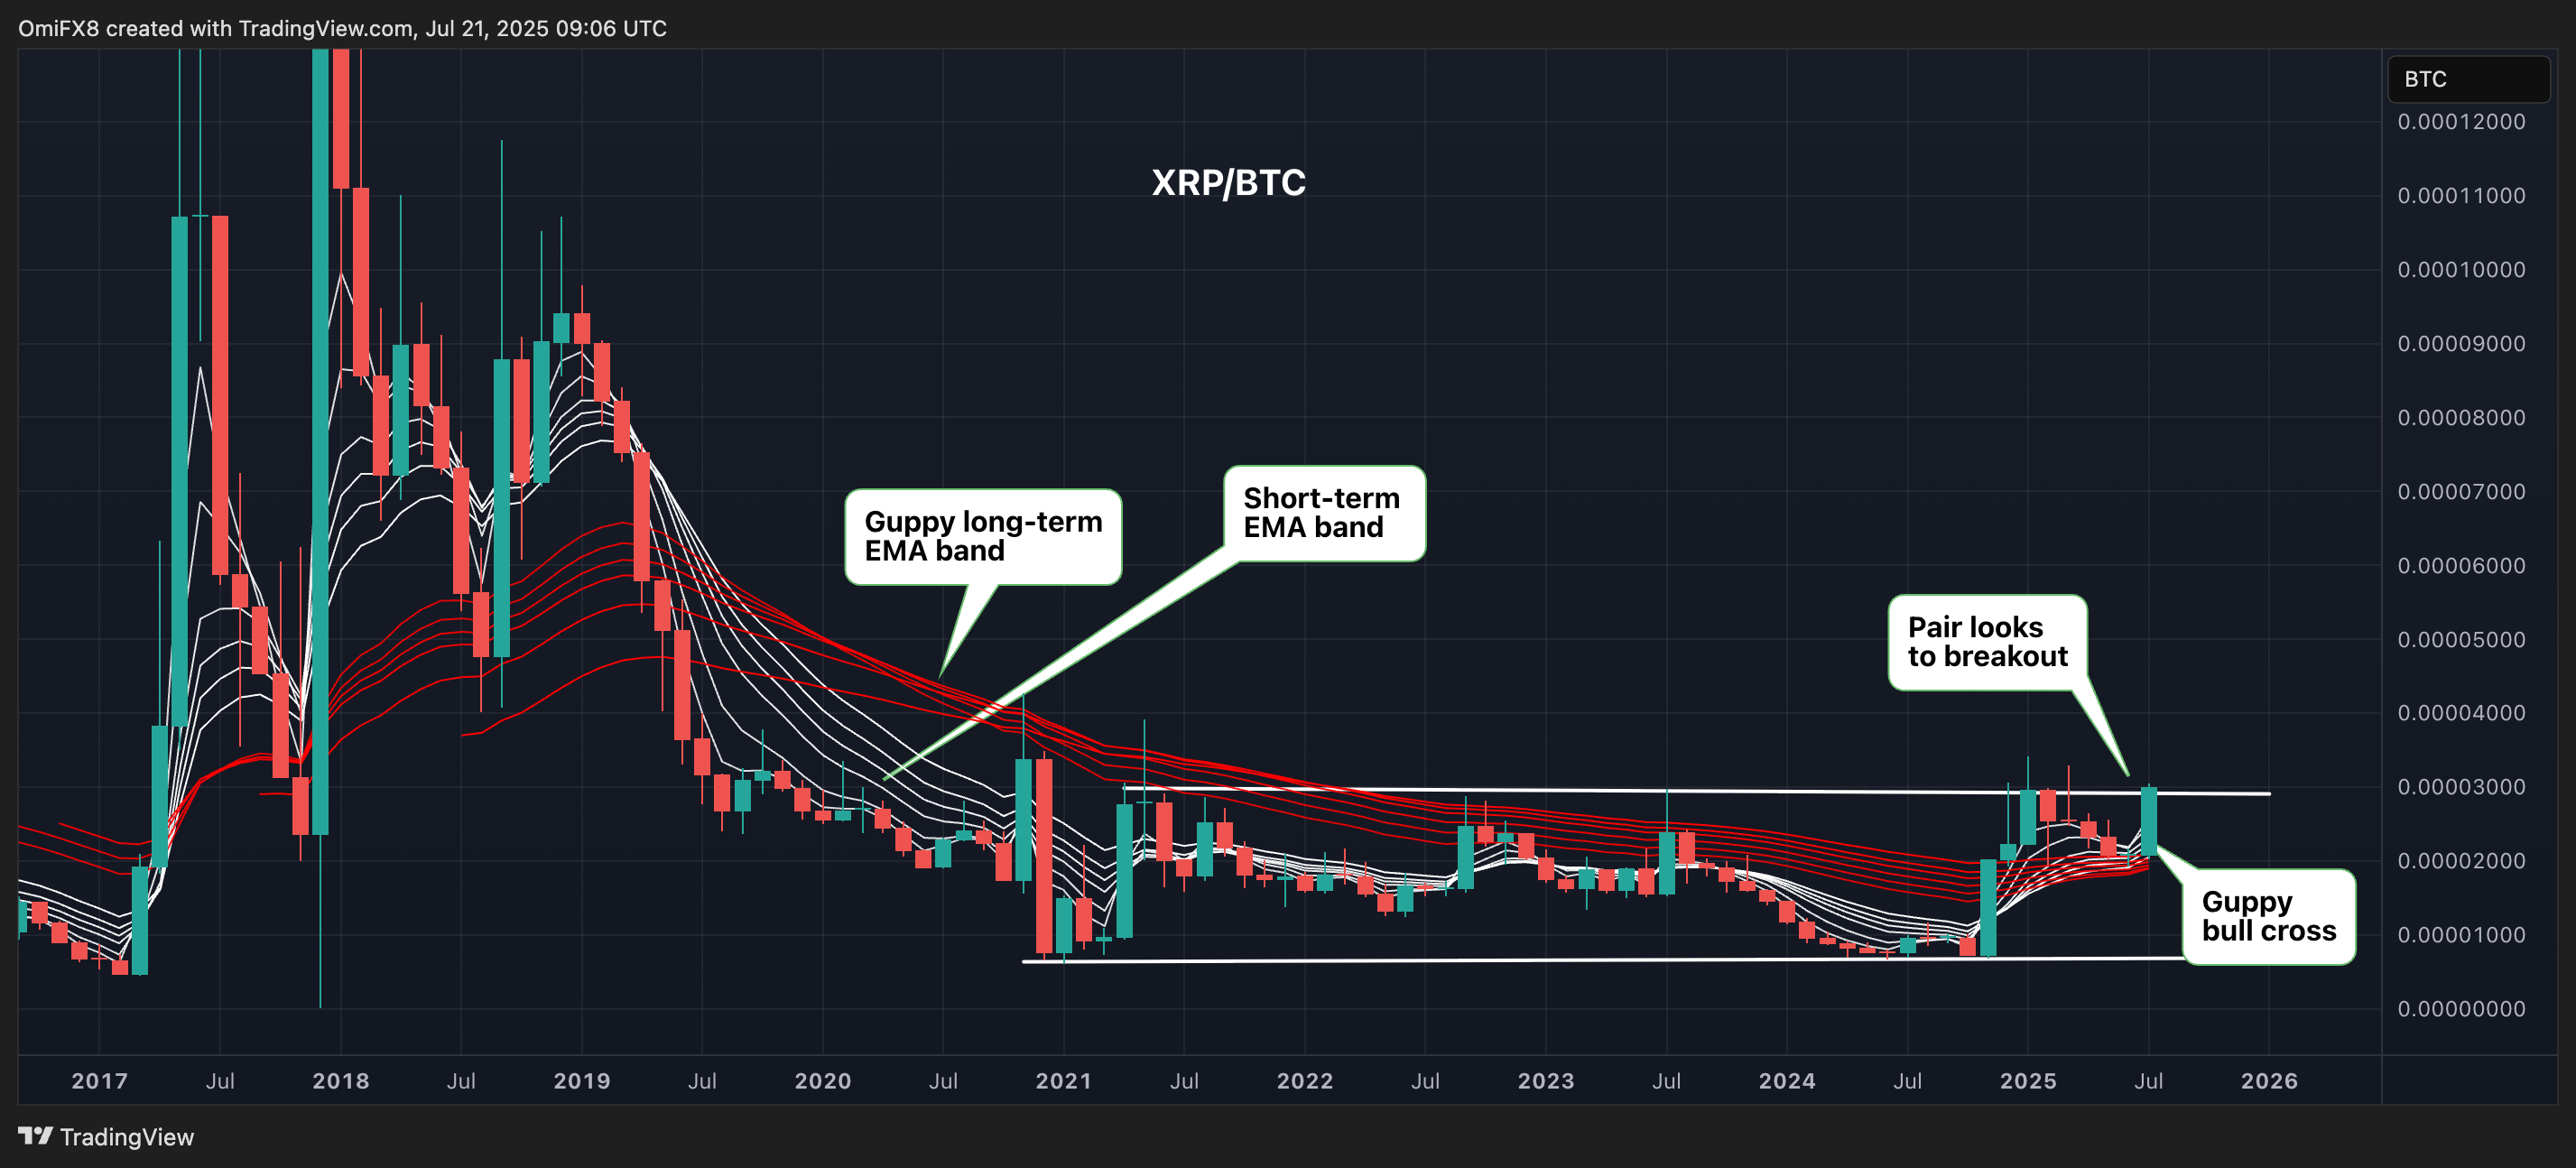
Supporting the bull case is the Guppy multiple moving average indicator, which has flipped bullish for the first time since 2018. The bullish signal is identified by the short-term EMA band (white) crossing above the long-term ones (red).
XRP/USD : Golden cross is here
XRP looks set for a continued run higher, having defended the support of the January high of $3.39 over the weekend in a classic “breakout and re-test play.” Markets tend to revisit resistance-turned-support to test dip demand and commitment of bulls before staging bigger rallies.
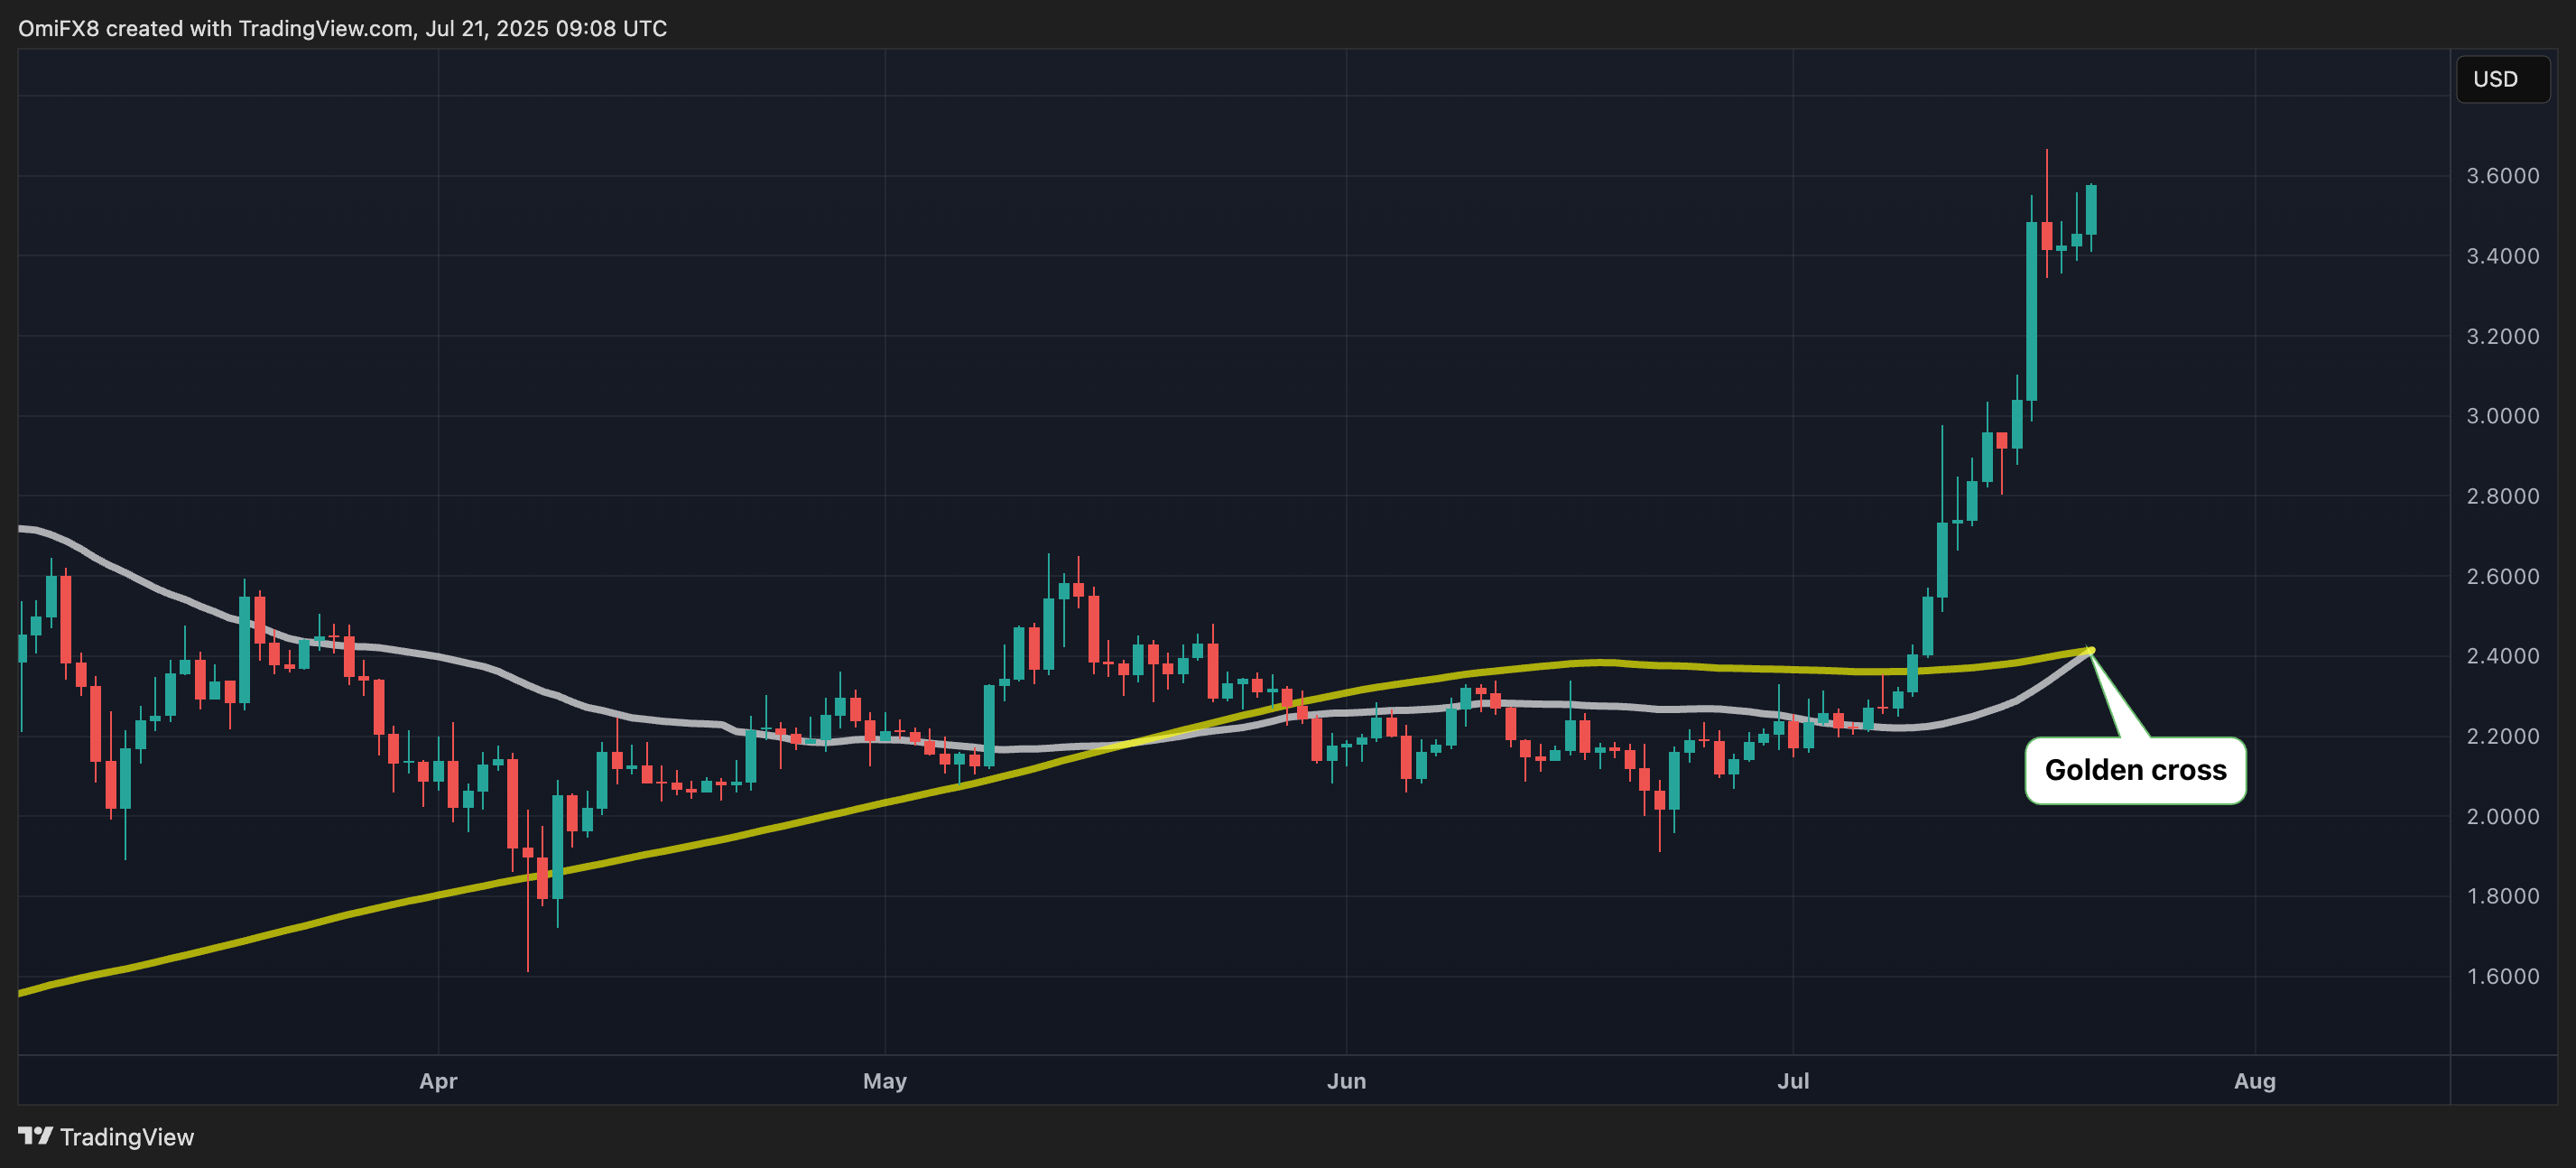
Momentum looks stronger than ever with the bullish golden cross, marked by the 50-day simple moving average (SMA) shifting above the 200-day SMA, while prices are already at record highs. Friday’s high of $3.66 is the immediate resistance, followed by $4.00. Below $3.35, the risk of an extended pullback would increase.
- AI’s take: Given that XRP/BTC is at the “upper end of a four-year-long sideways channel,” this suggests a major, long-term breakout could be imminent. For such a significant event, many traders would lean towards waiting for clear confirmation (e.g., a strong daily or even weekly close above the channel resistance, potentially with high volume) rather than jumping in prematurely.
- Resistance: $3.66, $4.
- Support: $3.35, $3, $2.65.
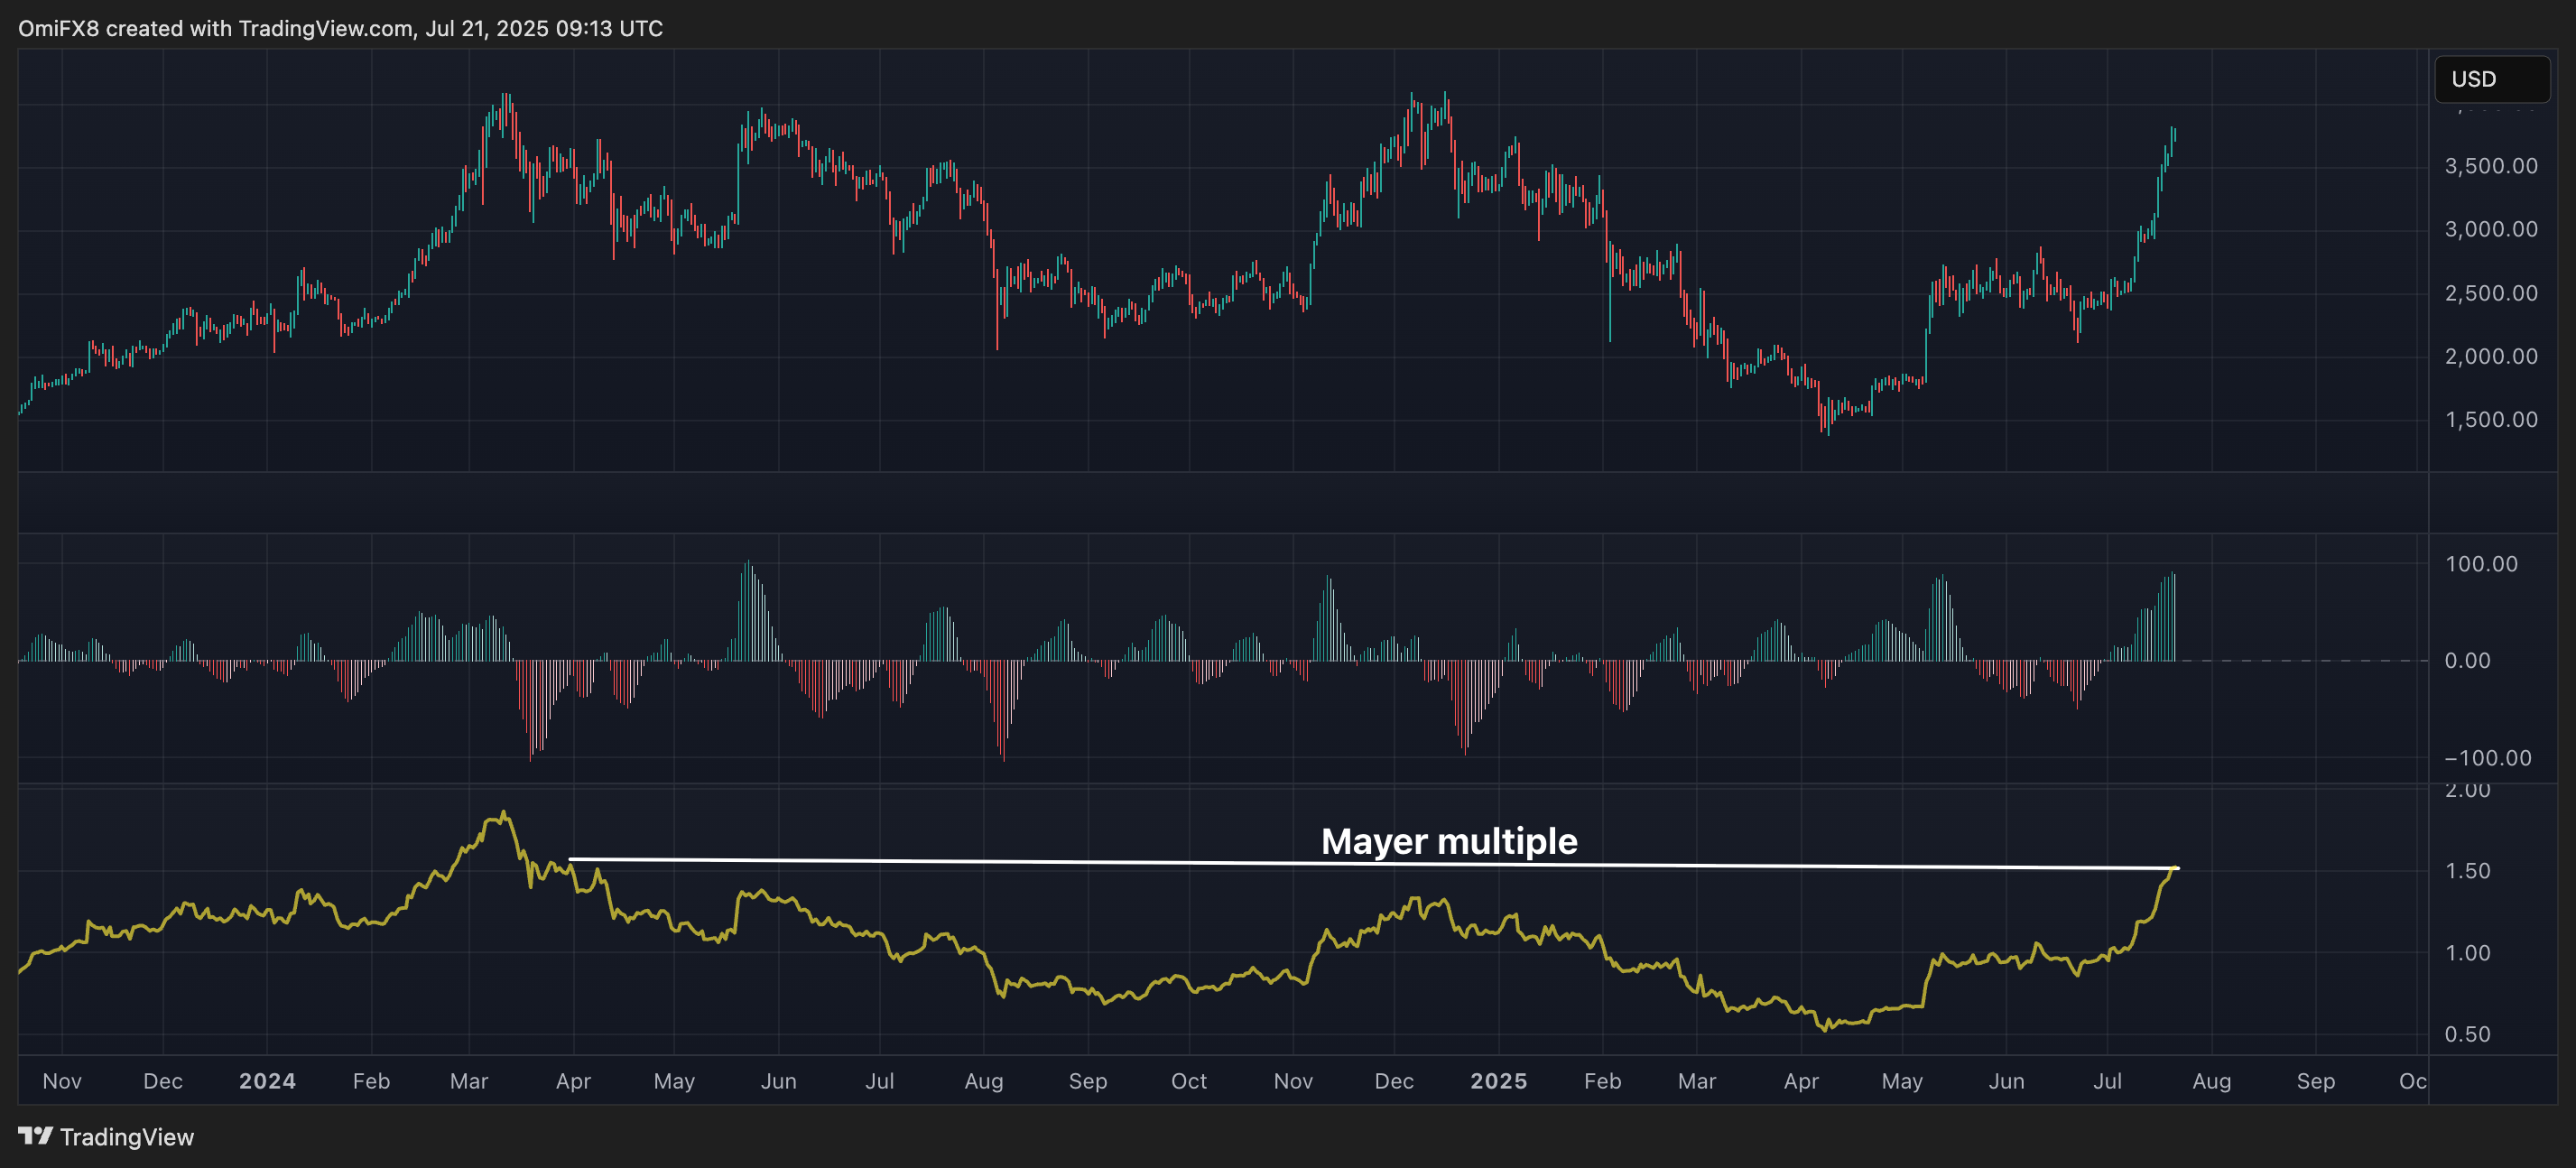
Ether: Mayer multiple takes out December high
Ether’s (ETH) rally continues, with the 50-day SMA rising to its highest level since March and the 100-day SMA poised to cross above the 200-day SMA in a bullish manner. There is little to no sign of bears looking to reassert themselves, as evident from the small upper wicks attached to most daily candles since July 13.
The Mayer multiple, which gauges the ratio between the spot price and the 200-day SMA to show case momentum, has already crossed the December high to hit its highest since March 2024. Perhaps, it’s only a matter of time before prices do the same, topping the December high of $4,109.
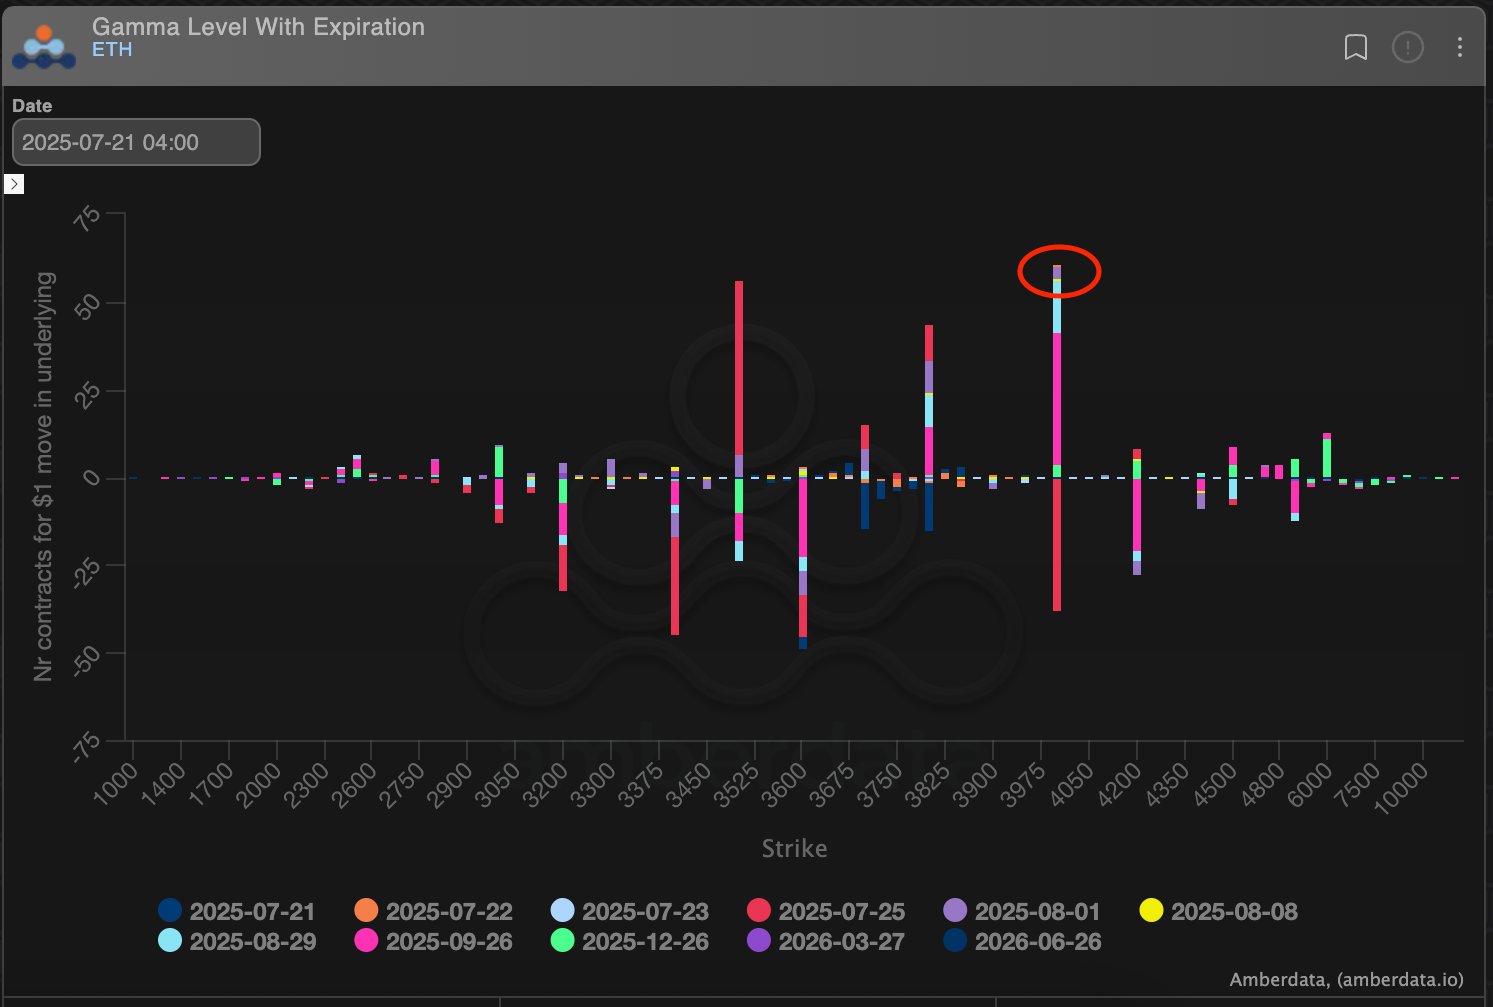
On the way higher, prices may consolidate near $4,000, thanks to the significant positive dealer gamma at that level in the Deribit-listed options market. Dealers typically trade against the market direction in such situations to maintain a net neutral exposure, curbing volatility.
On the downside, $3,480 is the key support. A break below the same would invalidate the bullish higher lows pattern.
AI’s take: The Mayer Multiple suggests strong underlying momentum. This indicator’s higher reading signals ETH is building bullish strength relative to its long-term average, hinting at potential for future price appreciation.
Resistance: $4,000, $4,109, $4,382.
Support: $3,480, $3,081, $2,879.
Bitcoin: Averages signal weak momentum
Bitcoin’s price continues to crisscross the 50-, 100- and 200-hour SMAs, with the three averages now flat-lined in a narrow range, signaling that the upside momentum has weakened. This makes BTC vulnerable to potential risk-off in traditional markets and the ongoing recovery in the dollar index.
A potential failure to hold above the Asian session low of $116,539 would reinforce the bull exhaustion, strengthening the case for a deeper drop to $111,965, the May high. Conversely, a move above $120,000 could bring fresh highs, although prices have consistently failed to establish a foothold above that level since July 14.
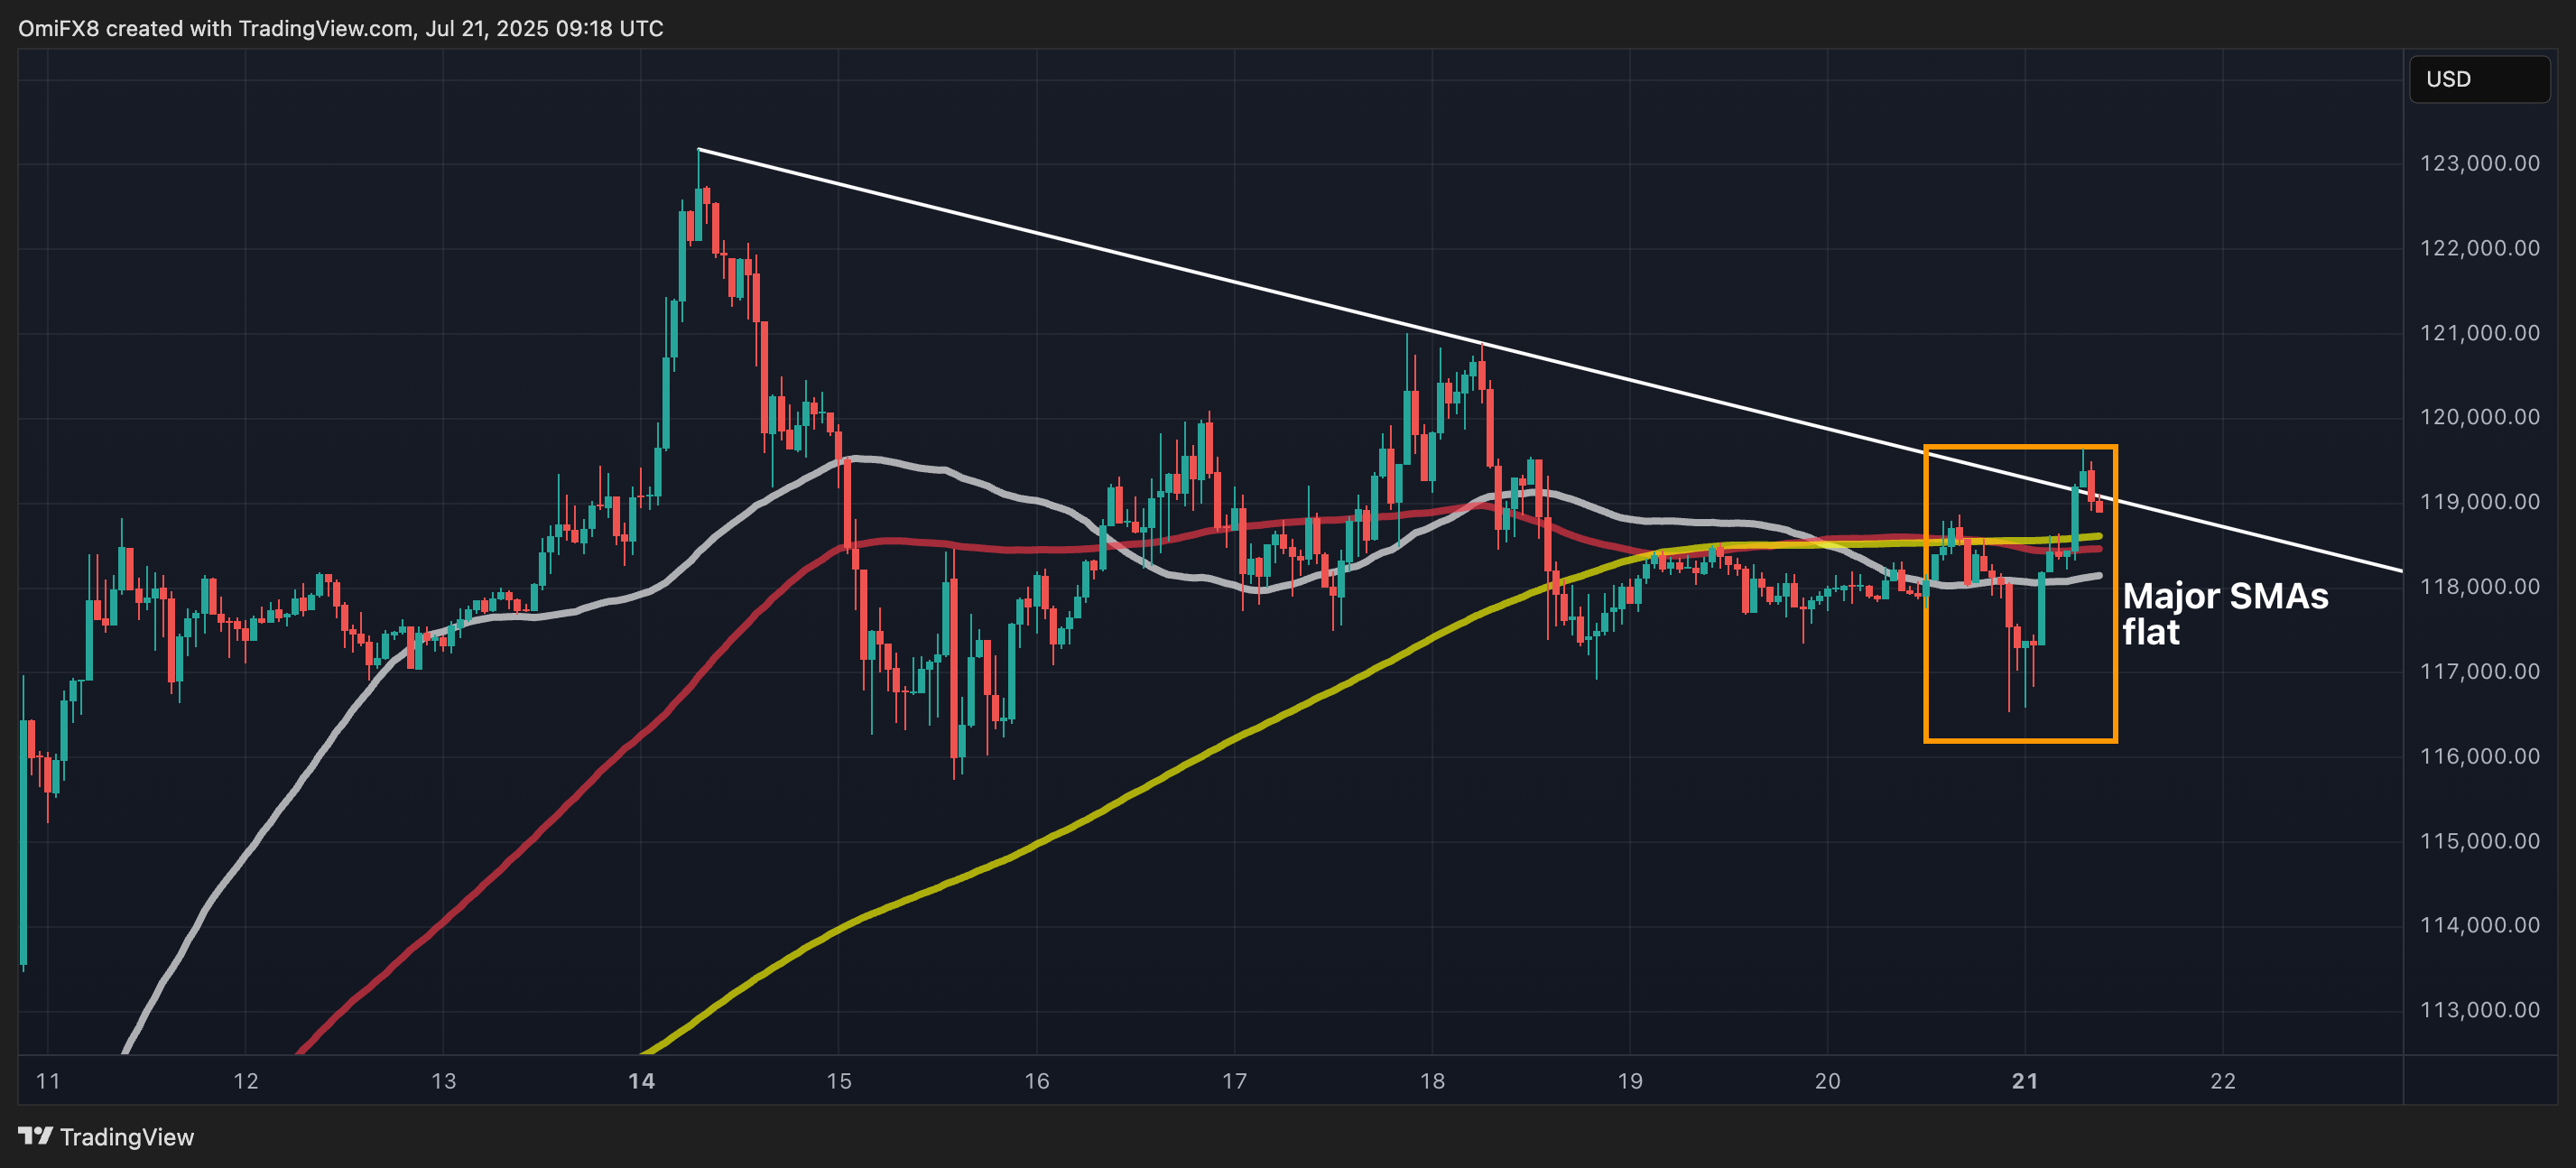
- AI’s take: The most prudent approach for many is to wait for Bitcoin to break decisively out of this consolidation phase (either above or below the flat-lined SMAs) with significant volume.
- Resistance: $120,000, $123,181.
- Support: $116,539, $115,739, $111,965.
Solana: Tops key resistance
Solana’s SOL token has topped resistance at around $185 as expected. Further gains appear likely as the MACD histogram prints larger bars above the zero line and the 14-day RSI surpasses 70, both signaling a strengthening of the upward momentum. The Mayer multiple has risen to the highest since January.
A failure to hold above $177 would raise the risk of a deeper price drop.
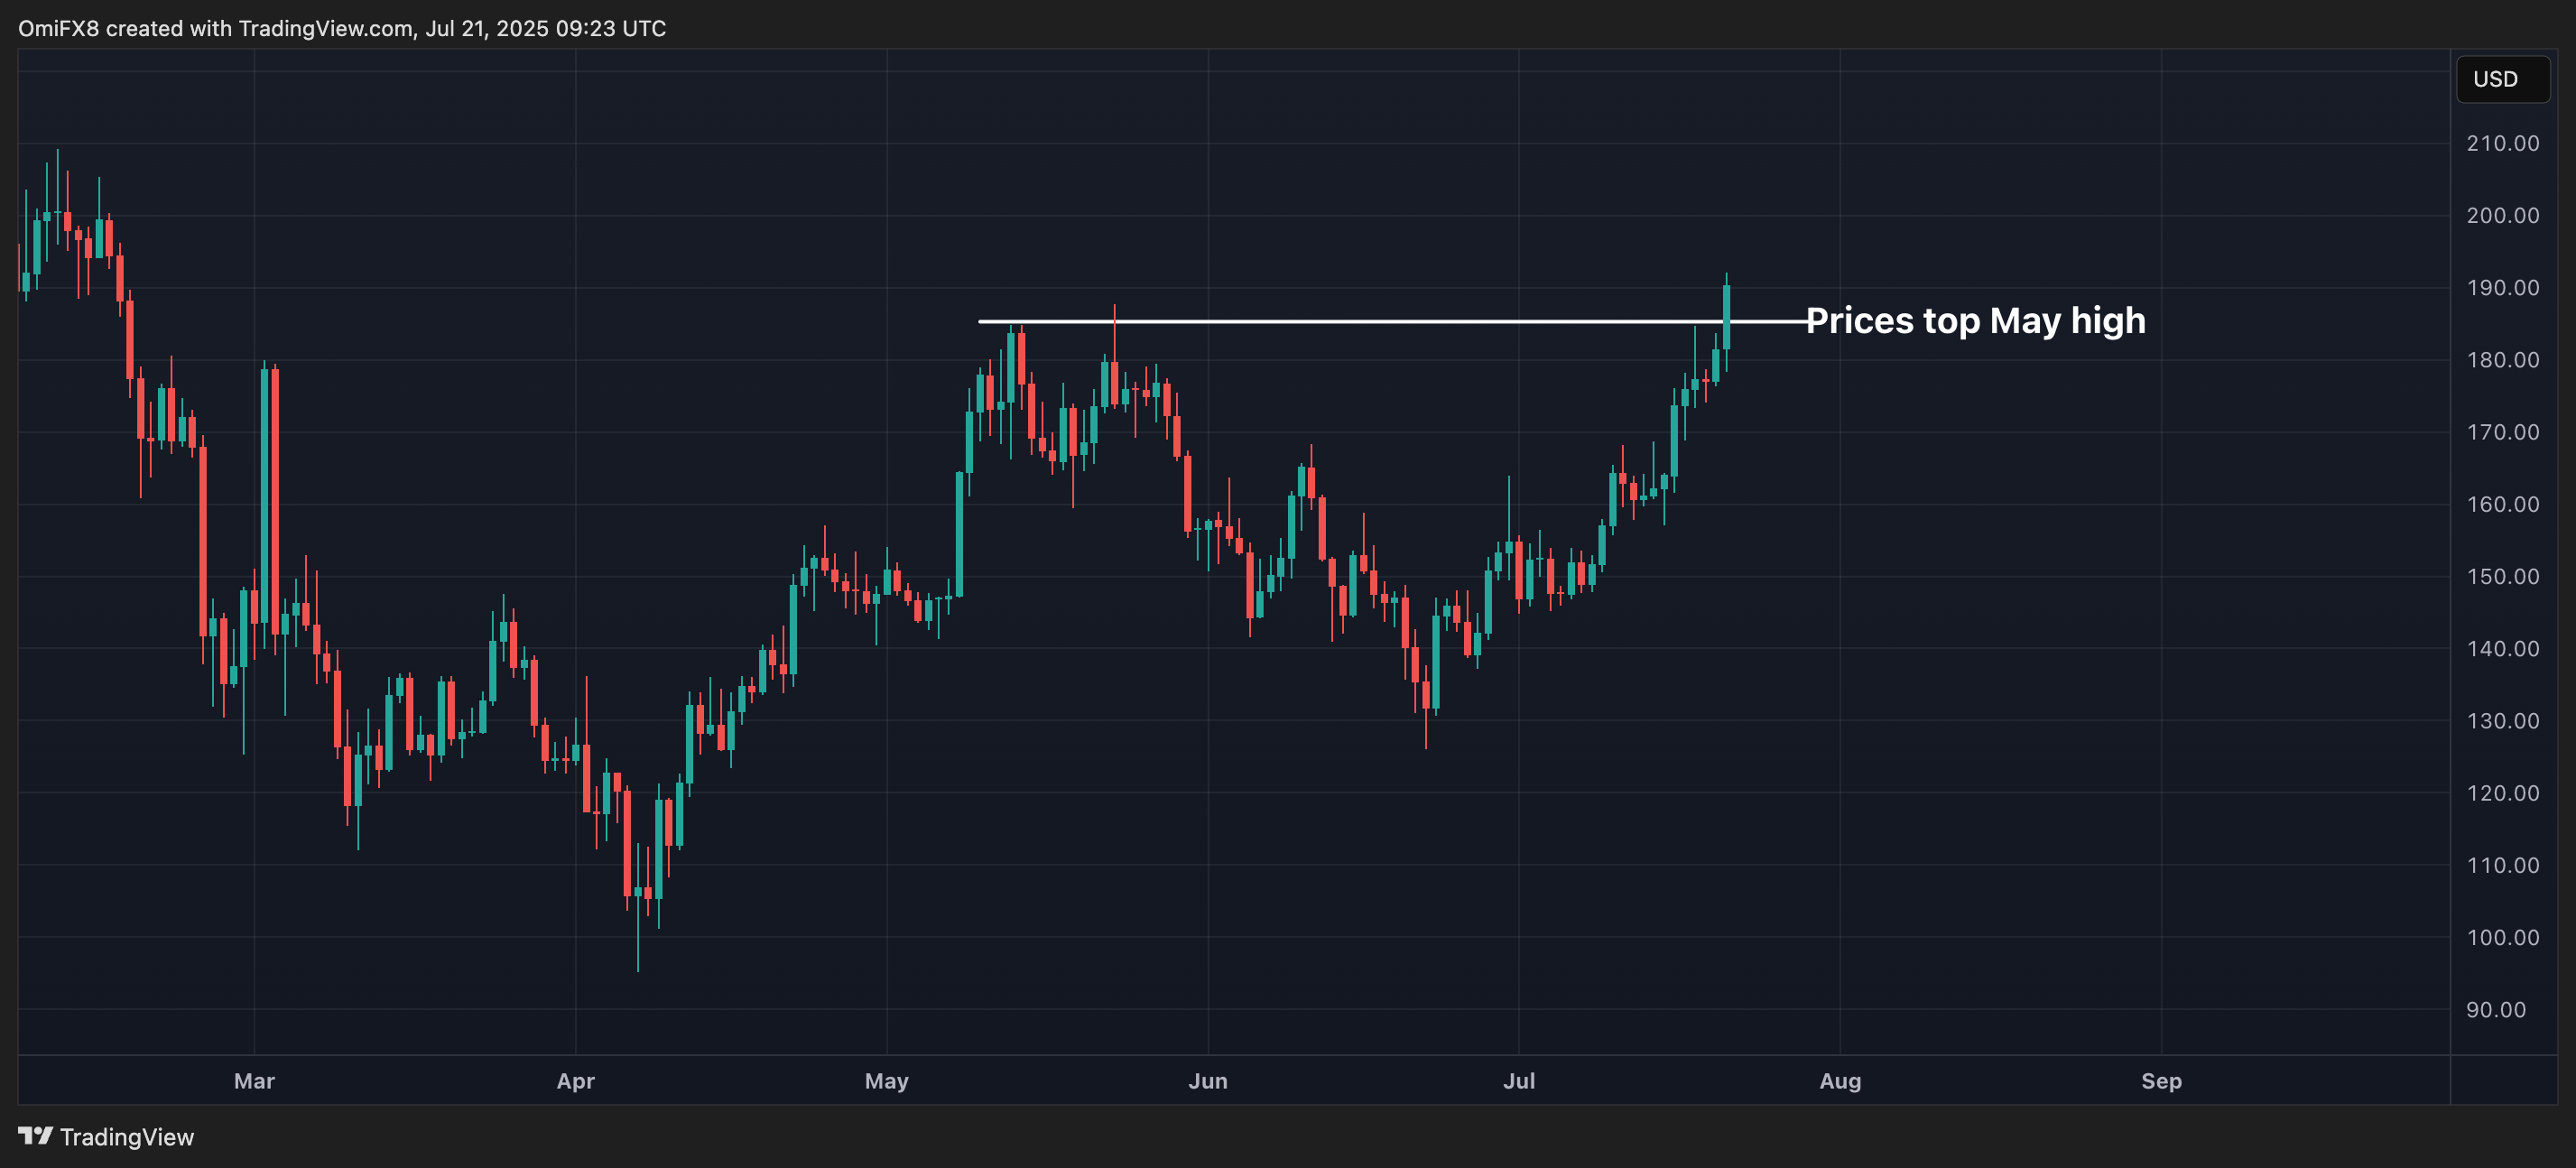
- AI’s take: Be mindful that an RSI above 70 indicates overbought conditions, so a brief consolidation or pullback isn’t uncommon before further ascent.
- Resistance: $200, $218, $252-$264
- Support: $185, $168, $157.