
 Bitcoin
  Ethereum
  Tether
  BNB
BNB  USDC
USDC  XRP
XRP  Solana
  TRON
TRON  Figure Heloc
  Hyperliquid
  Dogecoin
  USDS
USDS  LEO Token
  Wrapped stETH
  Zcash
Zcash  Canton
  Wrapped Bitcoin
  Binance Bridged USDT (BNB Smart Chain)
  Stellar
  WhiteBIT Coin
  LAB
LAB  Wrapped eETH
  Cardano
  USD1
USD1  sUSDS
sUSDS  Ethena USDe
  Coinbase Wrapped BTC
  Bitcoin Cash
  Litecoin
  Circle USYC
  WETH
WETH  Hedera
  Global Dollar
  Sui
Sui  USDT0
USDT0  Avalanche
  Shiba Inu
  NEAR Protocol
  BlackRock USD Institutional Digital Liquidity Fund
  Ethena Staked USDe
  Ondo US Dollar Yield
  Bittensor
  World Liberty Financial
  PAX Gold
  Aster
Aster  OKB
OKB  Ripple USD
  Worldcoin
  HTX DAO
  Ondo
Ondo  syrupUSDC
  Falcon USD
  Pi Network
  USDD
USDD  Polkadot
  Aave
Aave  BFUSD
BFUSD  Sky
Sky  Pepe
Pepe  Jupiter Perpetuals Liquidity Provider Token
  Quant
Quant  Spiko EU T-Bills Money Market Fund
  KuCoin
  Stable
  Jito Staked SOL
  MemeCore
  Janus Henderson Anemoy Treasury Fund
  USDGO
USDGO  Cosmos Hub
  Binance-Peg WETH
  Render
  Rocket Pool ETH
  Algorand
  Binance Bridged USDC (BNB Smart Chain)
  POL (ex-MATIC)
  JUST
JUST  Function FBTC
  USDtb
USDtb  币安人生 (BinanceLife)
  Velvet
  Audiera
  NEXO
NEXO  syrupUSDT
  Jupiter
  Ethena
  Gate
Gate  Binance Staked SOL
  Janus Henderson Anemoy AAA CLO Fund
  Beldex
  Venice Token
  ADI
ADI  Spiko Amundi Overnight Swap Fund (EUR)
  NEW X CEO IS BACK
  Polygon Bridged USDC (Polygon PoS)
  Pump.fun
  Solv Protocol BTC
  Flare
Flare  Filecoin
  YLDS
YLDS  clBTC
clBTC  Usual USD
  Midnight
  TrueUSD
  Aptos
Aptos  StakeWise Staked ETH
  A7A5
A7A5  Arbitrum
  Kinetiq Staked HYPE
  Aerodrome Finance
  tBTC
tBTC  Injective
  Lighter
  EURC
EURC  Jito
Jito  Ondo Short-Term U.S. Government Bond Fund
  c8ntinuum
  PRIME
PRIME  Mantle Staked Ether
  VeChain
  Artificial Superintelligence Alliance
  Polygon PoS Bridged DAI (Polygon POS)
  Pudgy Penguins
  Official Trump
  COCA
COCA  Bonk
Bonk  Virtuals Protocol
  Celestia
  Liquid Staked ETH
  Arbitrum Bridged WBTC (Arbitrum One)
  Terra Luna Classic
  Sun Token
  The9bit
  SPX6900
  Wrapped Flare
  Ether.fi
  L2 Standard Bridged WETH (Base)
  ETHGas
  Steakhouse USDC Morpho Vault
  Kinesis Gold
  Grass
Grass  Curve DAO
  apxUSD
  Binance-Peg XRP
  Ether.Fi Liquid ETH
  Pyth Network
  Noon
Noon  AINFT
AINFT  Plasma
  Bitcoin SV
  Legacy Frax Dollar
  Jupiter Staked SOL
  Olympus
  Savings USDD
  Zebec Network
  MegaUSD
  Marinade Staked SOL
  BUILDon
 Top 3 Price Prediction: Bitcoin, Ethereum, Ripple – BTC consolidates while Ethereum and Ripple prepare for breakout

- Bitcoin price has consolidated between $116,000 and $120,000 after reaching a new all-time high of $123,218 last week.
- Ethereum price closes above the daily resistance at $3,730, with bulls targeting the $4,000 mark.
- Ripple’s XRP finds support at a key level at $3.40, hinting at a sign of rally continuation.
Bitcoin (BTC) is taking a breather after reaching a record high of $123,218 last week, consolidating within a tight range as traders await the next move. Meanwhile, Ethereum (ETH) and Ripple (XRP) are showing signs of strength, finding support around their key levels and signaling a potential continuation of the upside.
Bitcoin trades sideways after reaching a new all-time high
Bitcoin price reached a new all-time high of $123,218 on Monday and has been trading sideways between the $116,000 and $120,000 levels. At the time of writing on Monday, it trades slightly above at around $117,800.
If BTC breaks below the lower consolidation boundary at $116,000 on a daily basis, it could extend the decline to retest its 50-day Exponential Moving Average (EMA) at $110,297.
The Relative Strength Index (RSI) on the daily chart reads 64 after falling from its overbought level of 70 last week, indicating fading bullish momentum. The Moving Average Convergence Divergence (MACD) indicator is about to flip a bearish crossover on the daily chart. If it shows a bearish crossover on a daily basis, it gives a selling signal and indicates a bearish momentum.
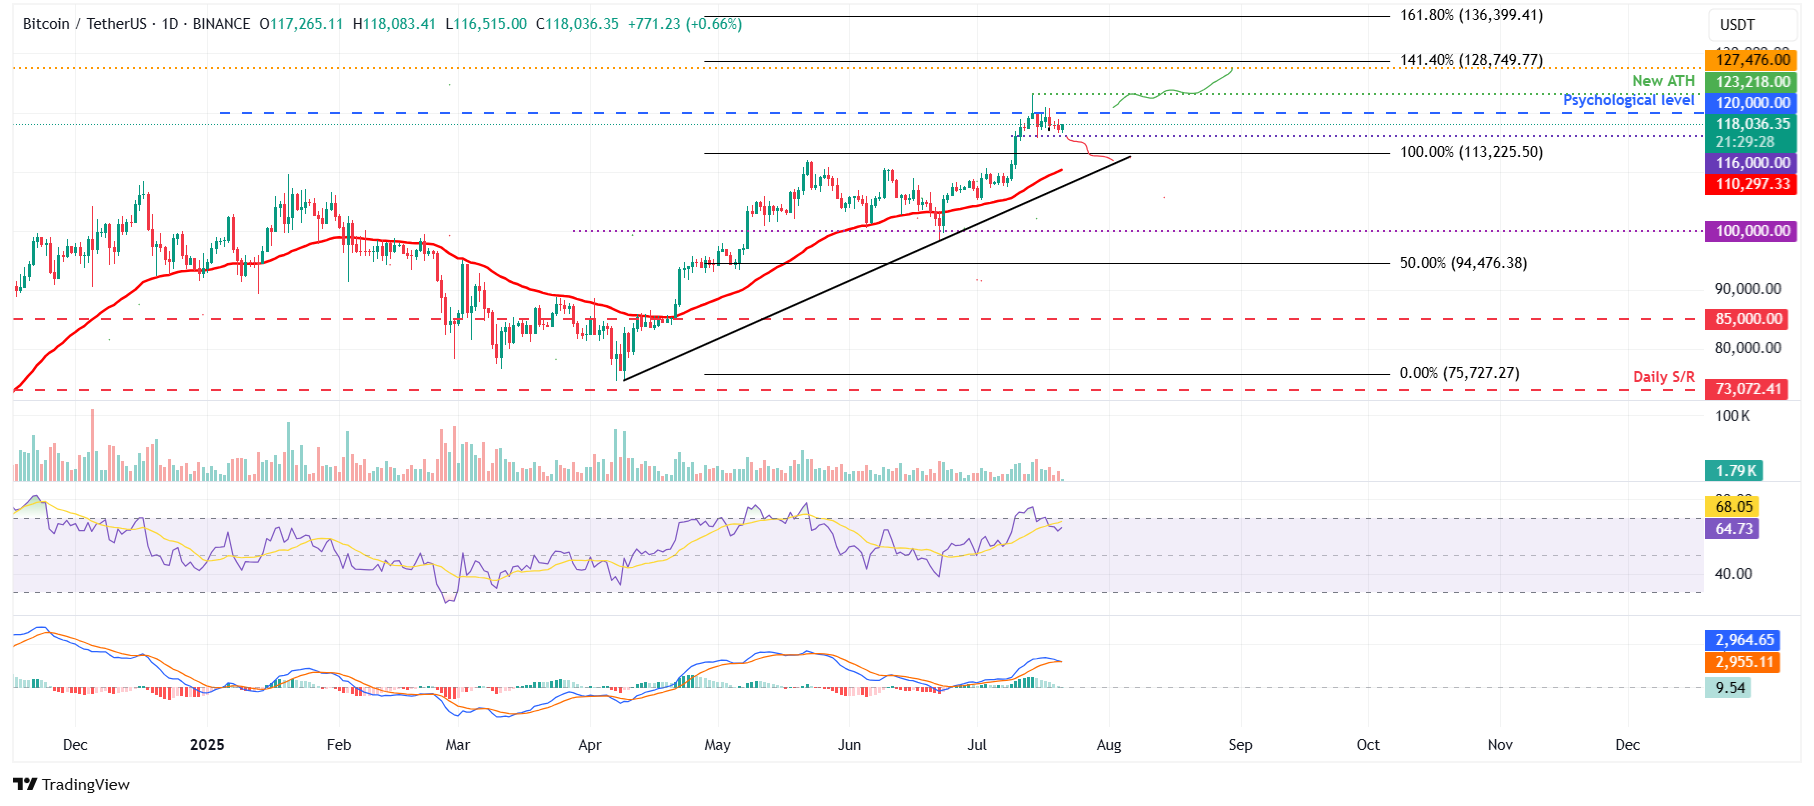
BTC/USDT daily chart
However, if BTC closes above the upper boundary of consolidation at $120,000 on a daily basis, it could extend the recovery toward the fresh all-time high at $123,218 and beyond.
Ethereum bulls aiming for $4,000 mark
Ethereum price rose 26.40% last week and closed above the daily resistance at $3,730 on Sunday. At the time of writing on Monday, it hovers at around $3,739.
If ETH continues its upward trend and the daily level at $3,730 holds as support, it could extend the rally toward its next key psychological level at $4,000.
The RSI on the daily chart reads 86, which is above its overbought level of 70, indicating strong bullish momentum. Meanwhile, the MACD indicator displayed a bullish crossover in early July that still holds. The rising green histogram bars above its neutral zero line suggest that bullish momentum is gaining traction.
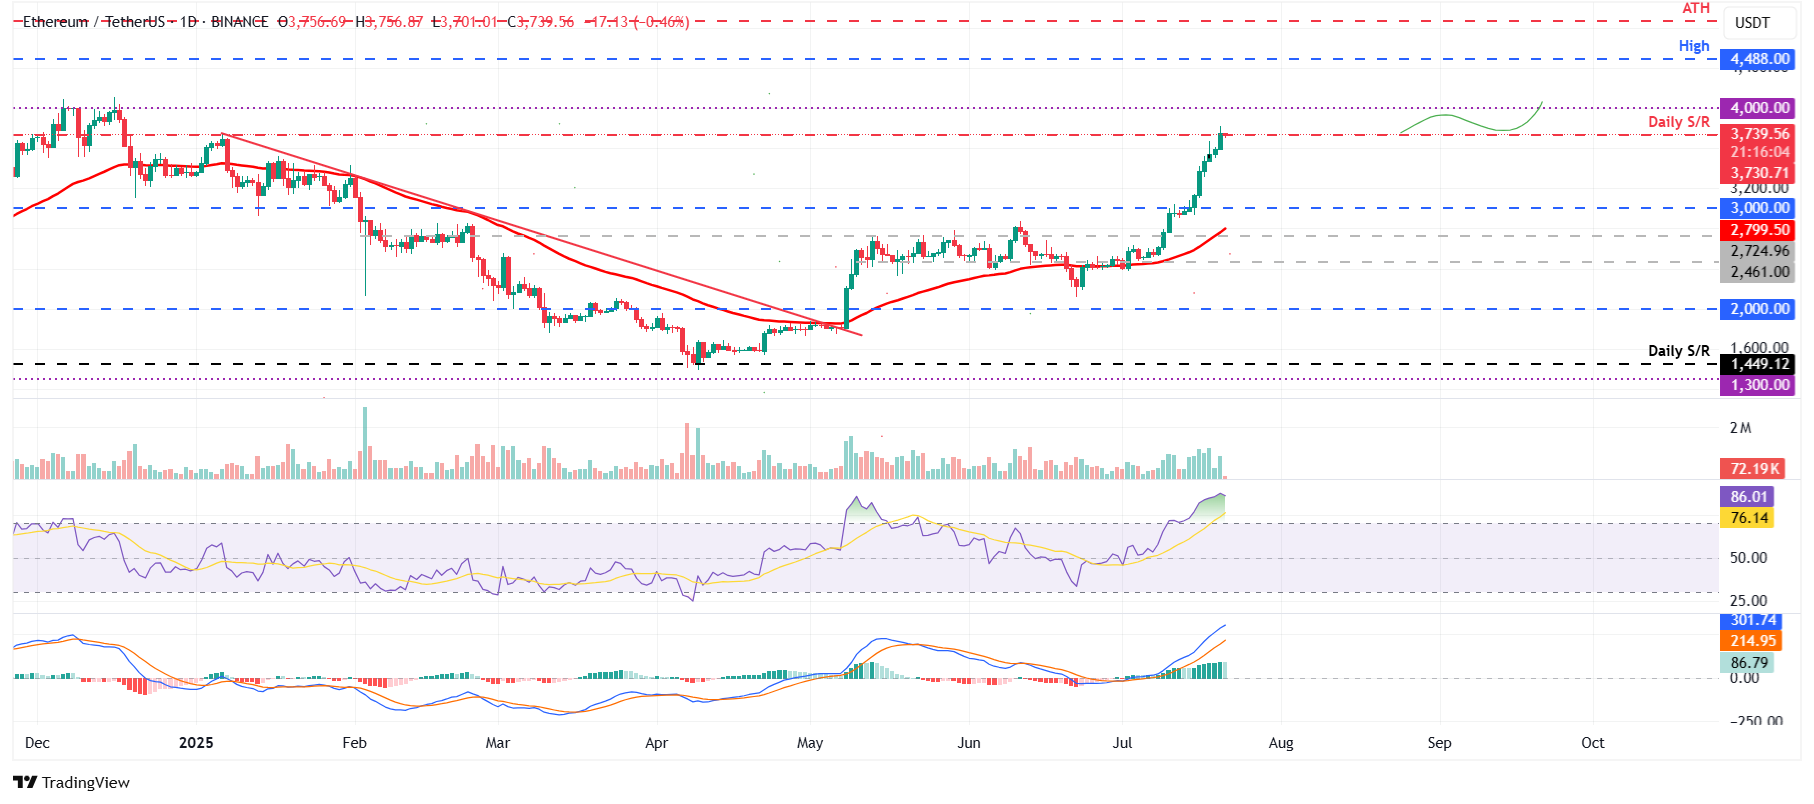
ETH/USDT daily chart
However, if ETH faces a pullback, it could extend the decline to find support around its key level at $3,000.
XRP finds support around its key level at $3.40
XRP price rallied by more than 20% last week, reaching a new all-time high of $3.66 on Friday. At the time of writing on Monday, it trades slightly higher at $3.47, having found support around the daily level of $ 3.40 during the weekend.
If XRP continues its upward trend, it could extend the rally toward the record level at $3.66. A successful close above this level will extend the rally toward its 141.40% Fibonacci extension level at $4.13, drawn from the January high of $3.40 to the April low of $1.61.
However, the RSI indicator on the daily chart reads 84, indicating an extreme overbought condition, which traders should be cautious of. Meanwhile, like Ethereum, the MACD indicator suggests further gains for XRP ahead.
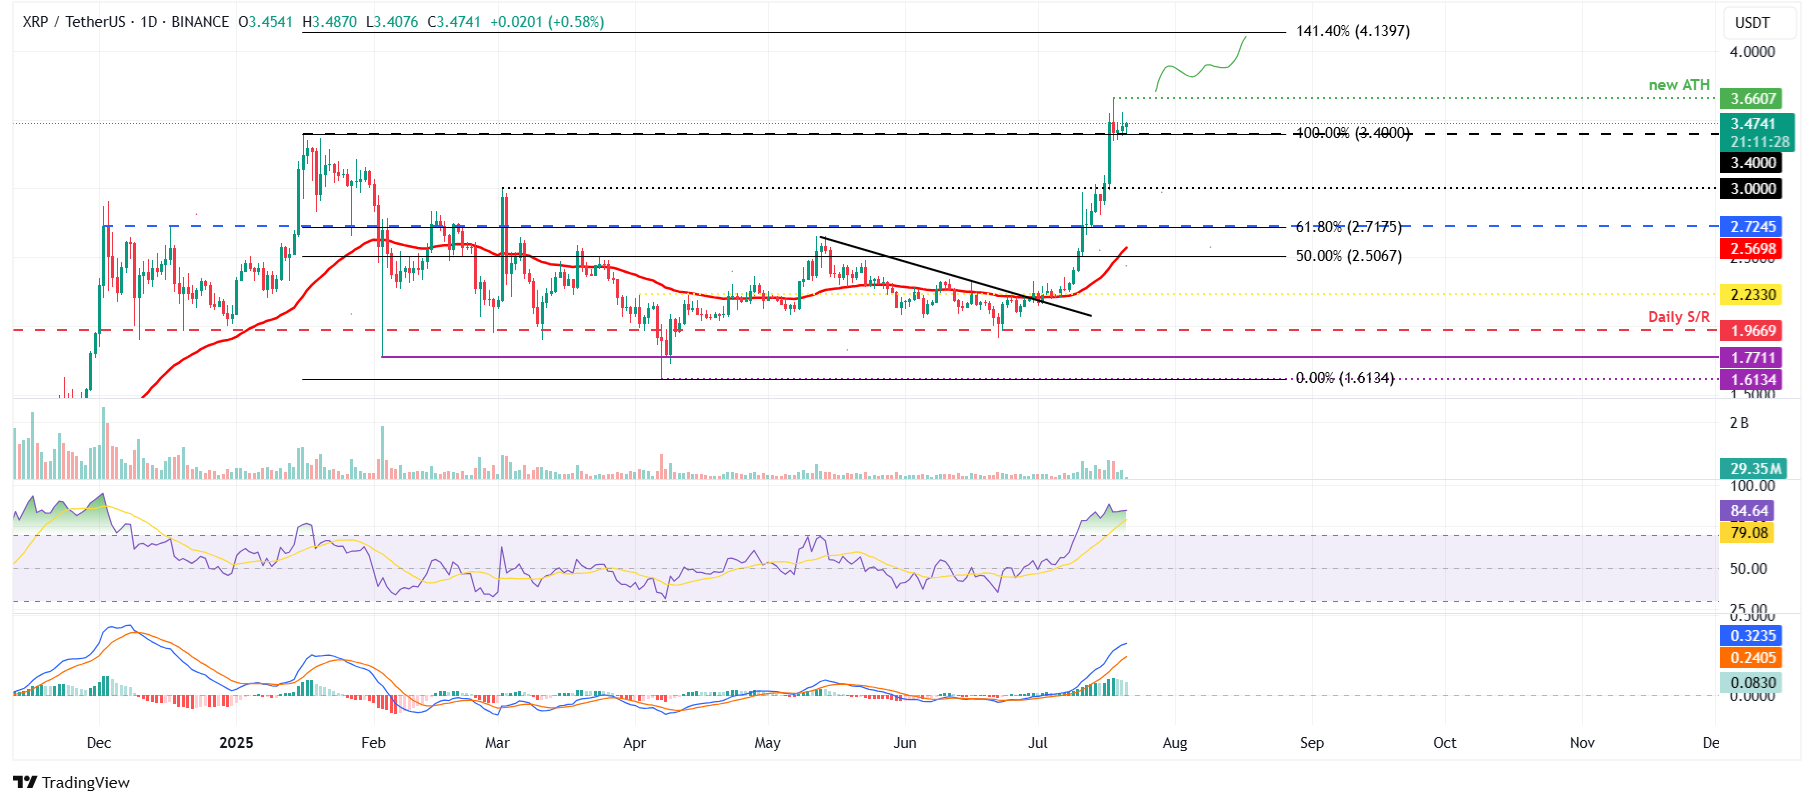
XRP/USDT daily chart
On the other hand, if XRP faces a correction, it could extend the decline to find support around its daily level at $3.40.