
 Bitcoin
  Ethereum
  Tether
  BNB
BNB  USDC
USDC  XRP
XRP  Solana
  TRON
TRON  Figure Heloc
  Hyperliquid
  Dogecoin
  USDS
USDS  LEO Token
  Wrapped stETH
  Zcash
Zcash  Stellar
  Wrapped Bitcoin
  LAB
LAB  Binance Bridged USDT (BNB Smart Chain)
  Canton
  WhiteBIT Coin
  Cardano
  Wrapped eETH
  USD1
USD1  sUSDS
sUSDS  Ethena USDe
  Coinbase Wrapped BTC
  Bitcoin Cash
  Litecoin
  Hedera
  WETH
WETH  Circle USYC
  Global Dollar
  Sui
Sui  USDT0
USDT0  Avalanche
  Shiba Inu
  BlackRock USD Institutional Digital Liquidity Fund
  NEAR Protocol
  Ethena Staked USDe
  Ondo US Dollar Yield
  Bittensor
  World Liberty Financial
  PAX Gold
  Aster
Aster  Worldcoin
  OKB
OKB  Ripple USD
  Ondo
Ondo  HTX DAO
  syrupUSDC
  Aave
Aave  Polkadot
  Falcon USD
  USDD
USDD  Pi Network
  BFUSD
BFUSD  Sky
Sky  MemeCore
  Jupiter Perpetuals Liquidity Provider Token
  Pepe
Pepe  Quant
Quant  Spiko EU T-Bills Money Market Fund
  KuCoin
  Jito Staked SOL
  Stable
  Janus Henderson Anemoy Treasury Fund
  USDGO
USDGO  Cosmos Hub
  Binance-Peg WETH
  Render
  Rocket Pool ETH
  POL (ex-MATIC)
  Binance Bridged USDC (BNB Smart Chain)
  Jupiter
  Algorand
  Function FBTC
  Ethena
  USDtb
USDtb  NEXO
NEXO  币安人生 (BinanceLife)
  Beldex
  syrupUSDT
  JUST
JUST  Gate
Gate  Janus Henderson Anemoy AAA CLO Fund
  Binance Staked SOL
  Audiera
  Venice Token
  Spiko Amundi Overnight Swap Fund (EUR)
  Filecoin
  Flare
Flare  NEW X CEO IS BACK
  Polygon Bridged USDC (Polygon PoS)
  ADI
ADI  Solv Protocol BTC
  YLDS
YLDS  Usual USD
  Pump.fun
  clBTC
clBTC  Midnight
  Aptos
Aptos  TrueUSD
  A7A5
A7A5  Injective
  StakeWise Staked ETH
  Arbitrum
  Kinetiq Staked HYPE
  Aerodrome Finance
  tBTC
tBTC  Lighter
  Ondo Short-Term U.S. Government Bond Fund
  EURC
EURC  Jito
Jito  PRIME
PRIME  c8ntinuum
  Official Trump
  Mantle Staked Ether
  Artificial Superintelligence Alliance
  Pudgy Penguins
  Polygon PoS Bridged DAI (Polygon POS)
  VeChain
  Bonk
Bonk  COCA
COCA  Celestia
  SkyAI
SkyAI  Liquid Staked ETH
  Virtuals Protocol
  Arbitrum Bridged WBTC (Arbitrum One)
  Terra Luna Classic
  Ether.fi
  The9bit
  Wrapped Flare
  Sun Token
  L2 Standard Bridged WETH (Base)
  SPX6900
  Steakhouse USDC Morpho Vault
  Kinesis Gold
  Curve DAO
  apxUSD
  Velvet
  Grass
Grass  Binance-Peg XRP
  Ether.Fi Liquid ETH
  ETHGas
  Pyth Network
  Plasma
  Noon
Noon  AINFT
AINFT  Olympus
  Jupiter Staked SOL
  BUILDon
  Savings USDD
  Legacy Frax Dollar
  Zebec Network
  Marinade Staked SOL
  JasmyCoin
Stellar (XLM) price action witnessed sideways movement for weeks. But the coin is ready to move out of this patter.
At press time, XLM price was up over 11% in the last 24 hours, confirming a breakout from a bullish flag pattern.
After weeks of sideways action, XLM may finally be ready to move higher, potentially as far as $1, if key technical indicators continue to hold strong.
From the liquidation setup to rising buying pressure and retail sentiment, all signs point toward another leg up. But one on-chain metric still shows a risk worth watching.
XLM Price Eyes 133% Upside As Stellar Breaks Bullish Flag Pattern
XLM price broke out of a classic bullish flag pattern. In technical analysis, a flag pattern forms when prices move sharply higher (the pole), then consolidate in a downward-sloping range (the flag), before breaking out again in the same direction.
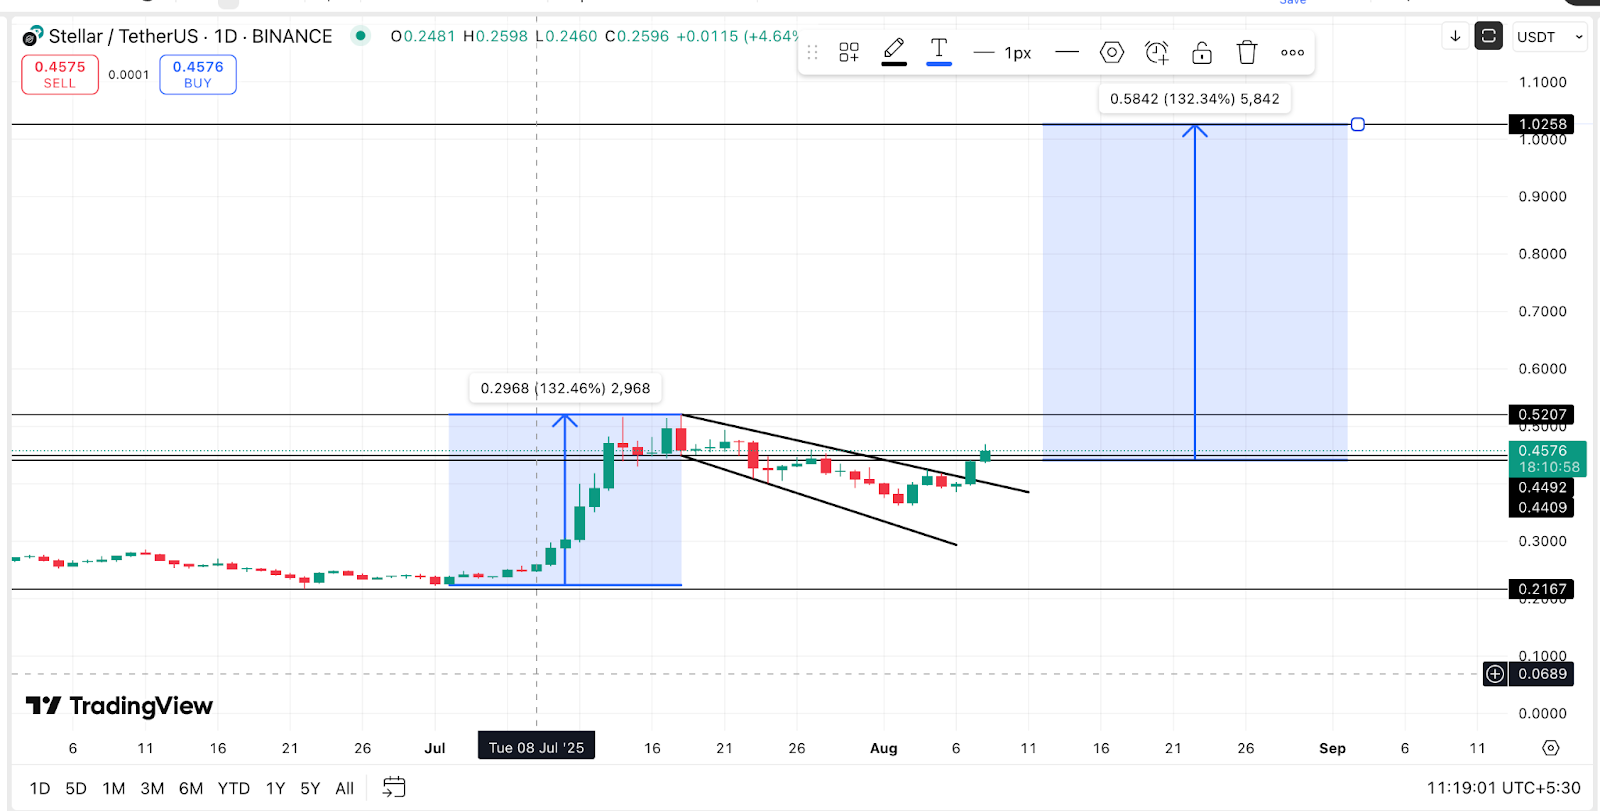
The XLM price chart depicts the height of the original flagpole, from around $0.23 to $0.52, to be about 133%.
A move toward the key psychological level of $1.00 emerges as the new target, using that same height from the breakout zone.
This type of structure typically shows strong market interest and sustained buying. The breakout candle was backed by high volume and is now pushing past short-term resistance near $0.46.
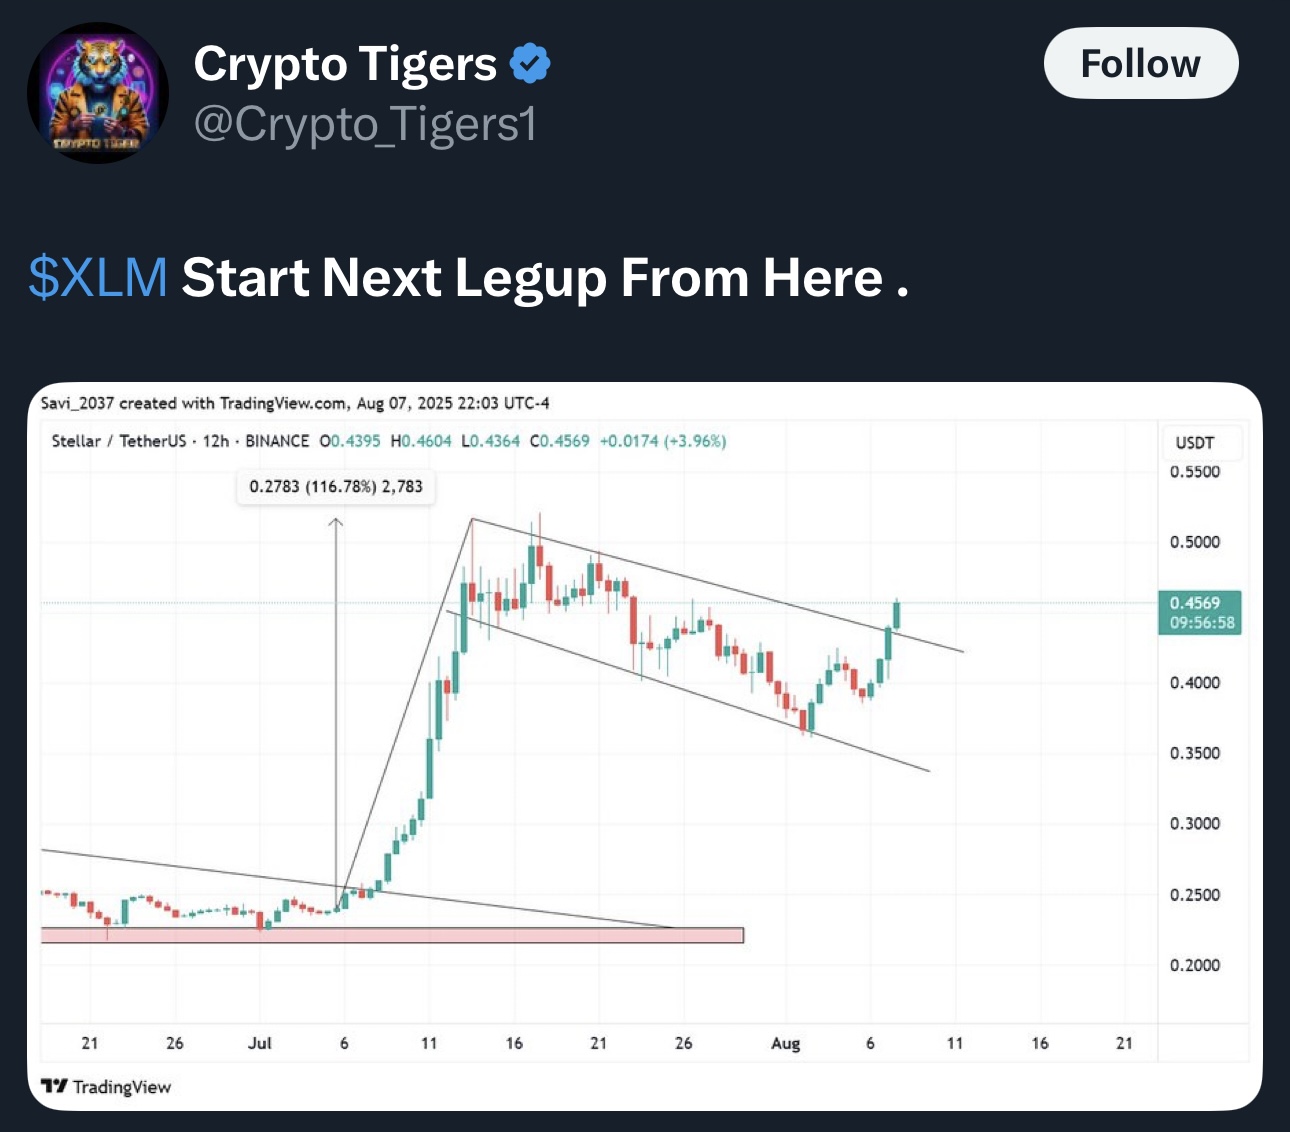
However, to confirm the rally, the first move has to be past $0.52. Do note that this analysis aligns with the expert analysis on X.
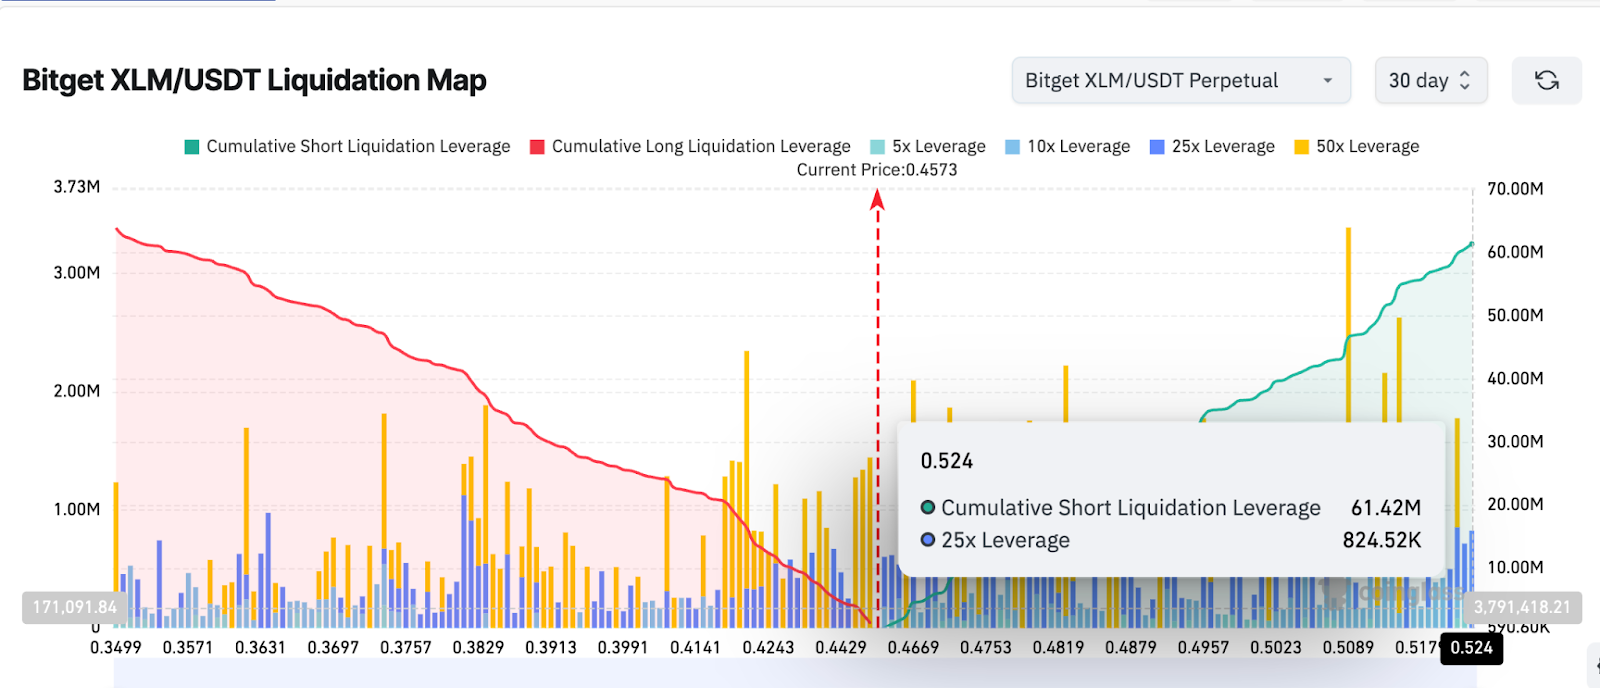
Short Squeeze May Continue With Over $60M in Shorts Still Open
According to the latest liquidation map, many short positions have already been wiped out, but over $52 million in XLM short contracts are still active on Bitget alone. That’s fuel for more upside.
When the XLM price rises quickly, traders betting against Stellar (shorts) are forced to buy back their positions, which pushes prices even higher.
This is known as a short squeeze. It’s what helped XRP rally recently, and Stellar price could be next.
If bulls maintain pressure and spot buying increases, XLM could trigger another liquidation cluster, possibly helping push prices to $0.52 and beyond.
What’s coincidental is that the peak of the short-liquidation cluster sits at $0.52, a level also mentioned on the price chart.
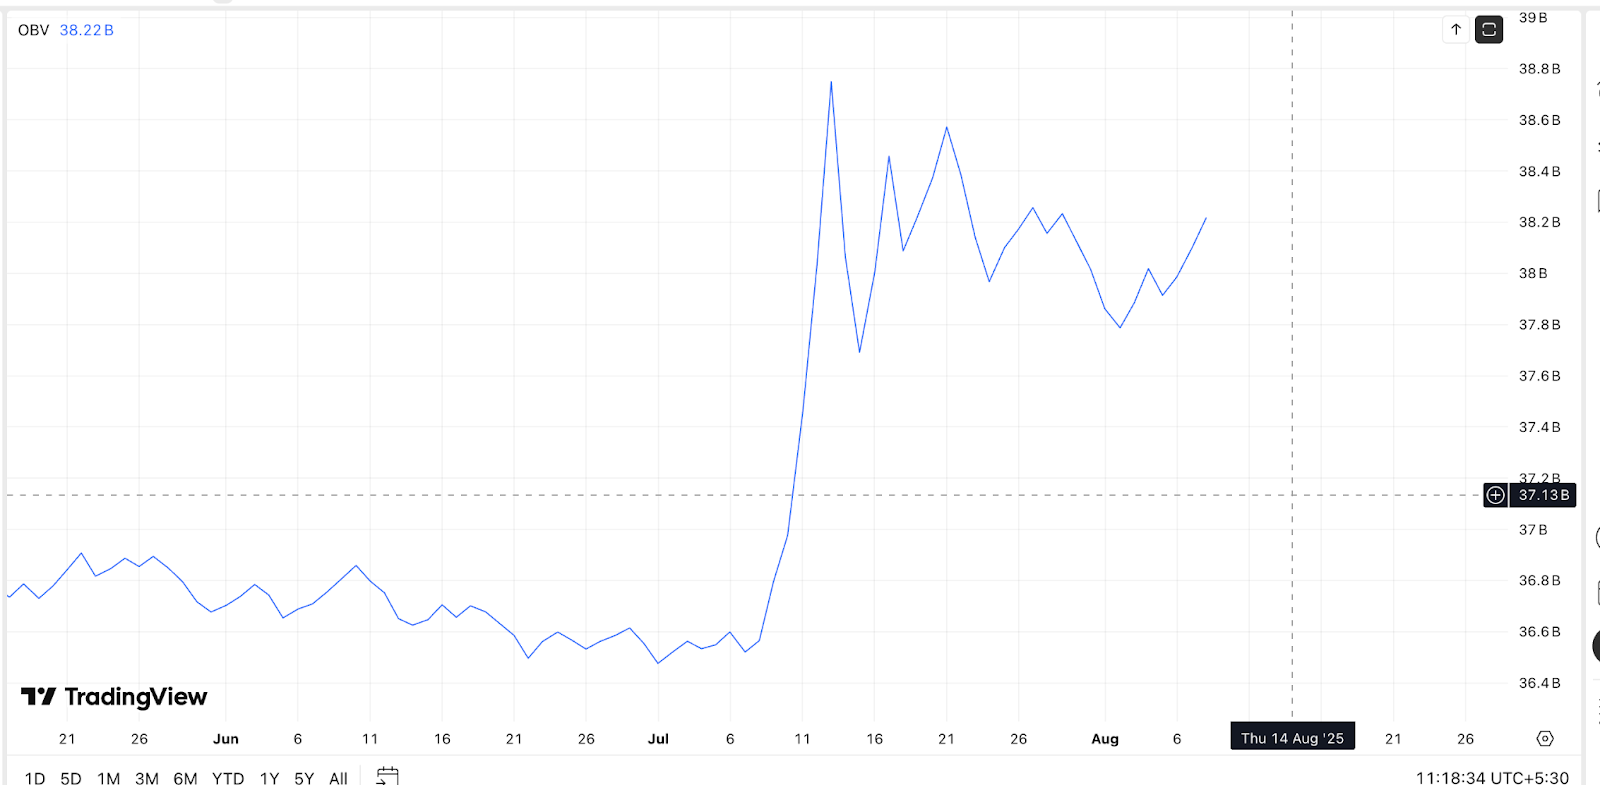
OBV and Bull-Bear Power Confirm Momentum
The On-Balance Volume (OBV) is climbing again, forming higher highs alongside price. This is a bullish signal for XLM price.
OBV tracks the running total of trading volume, adding volume on up days and subtracting it on down days. Rising OBV with rising price means demand is increasing.
The Bull-Bear Power (BBP) index is flashing green. This tool measures the difference between the highest price buyers are willing to pay and the lowest price sellers are interested in accepting.
A positive, or rather green, BBP indicator during a breakout shows that buying strength is in control.
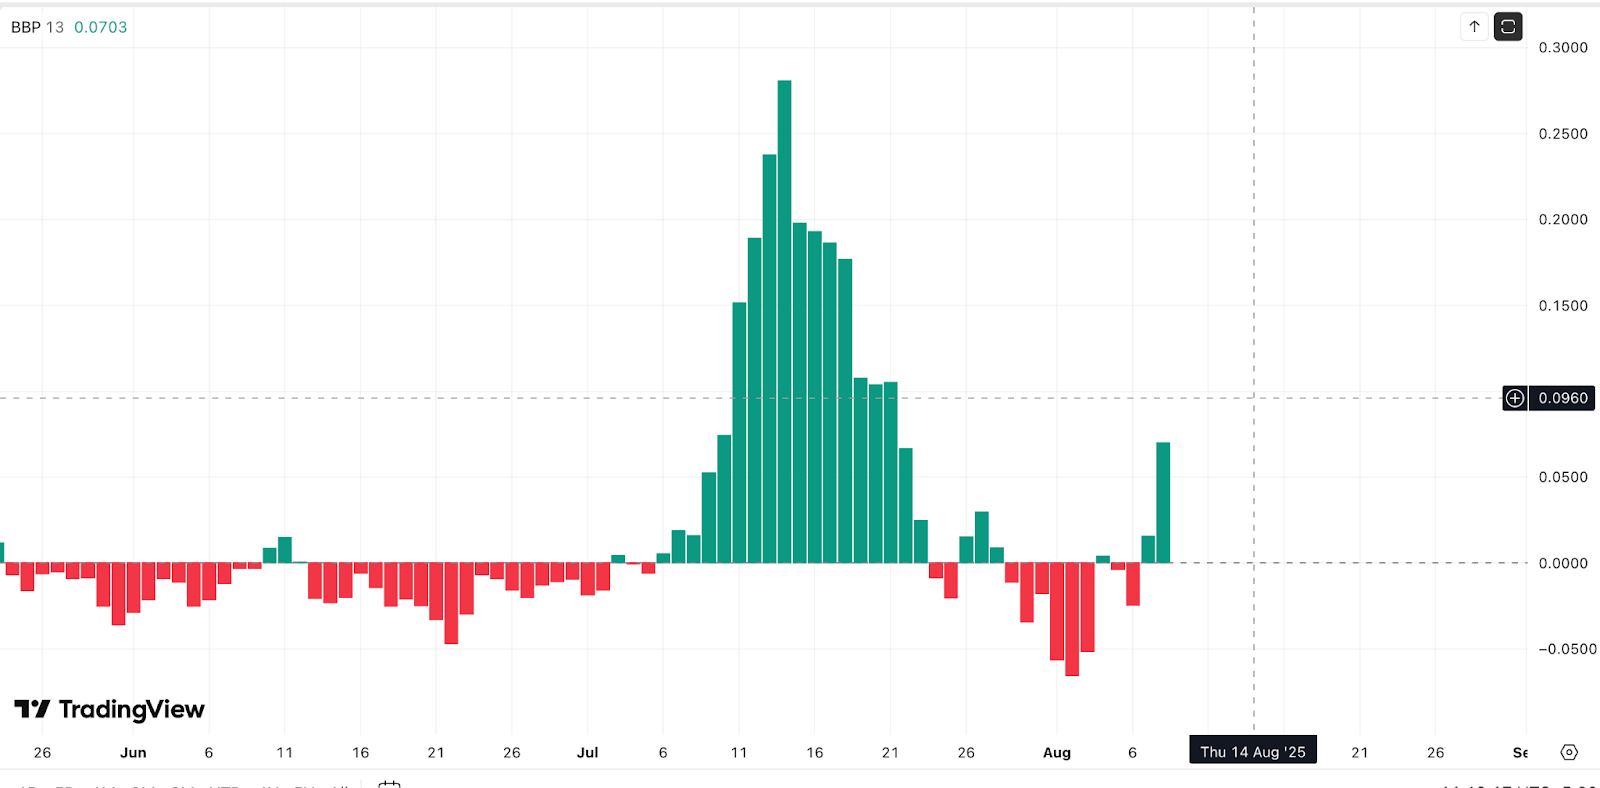
However, there’s one reason for trading-specific caution.
30-day net exchange flows have turned positive again, rising from under $1 million last week to over $9 million this week. This means more XLM is being sent to exchanges, possibly for profit-taking.
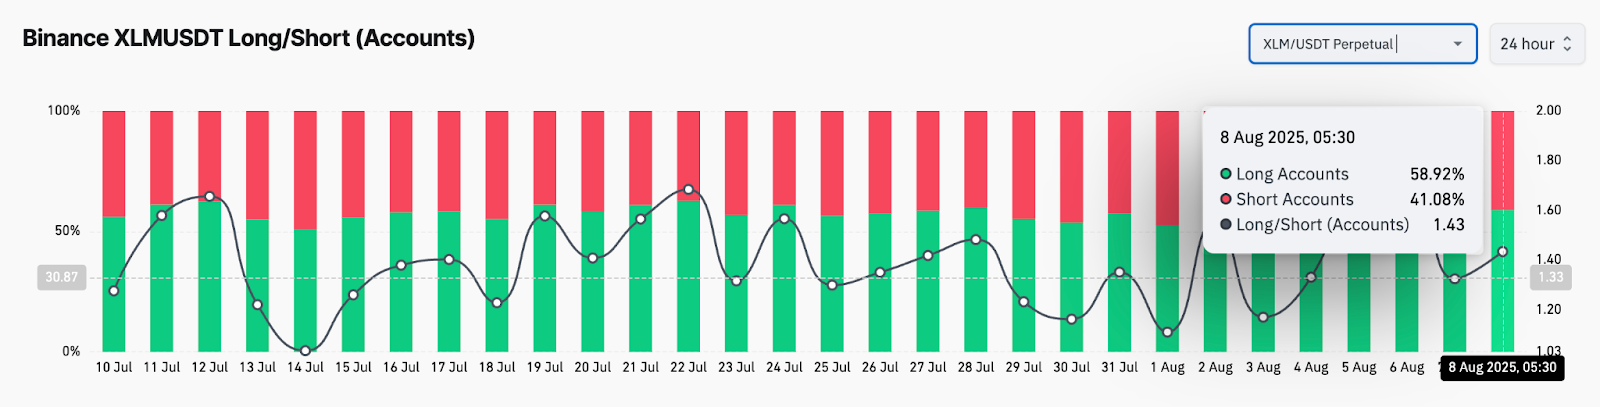
Traders Are Long, With $1 in Sight for Stellar Price
As per what Binance long/short ratio shows, almost 60% of trader accounts are currently long XLM. That means a growing bullish sentiment is in the works in retail circles.
While not extreme, this is enough to support continued price strength, especially if institutions join in.
As long as XLM price stays above $0.46 and bulls maintain volume, a move toward $0.52 is likely. Beyond that, $0.60 and $1.00 remain potential breakout targets based on the full flagpole extension.
However, the short-term setup gets invalidated if price dips back below $0.36, especially if netflows rise further.