$XRP’s price remained flat today, March, continuing the consolidation phase that began in February. However, ongoing inflows into exchange-traded funds and declining exchange supply suggest that a rebound may be on the horizon.
Summary
$XRP price has formed a double-bottom pattern pointing to a strong rebound.
The supply of $XRP tokens on exchanges has dropped to the lowest level in years.
Data shows that spot $XRP ETF inflows have continued rising this month.
Ripple ($XRP), one of the top cryptocurrencies, was trading at $1.4282 on Thursday, inside a range it has been in the past few weeks. This price is 28% above the year-to-date low of $1.1137.
American investors are still buying $XRP ETFs, a sign that they expect it to rebound in the coming weeks. SoSoValue data shows that spot $XRP ETFs added $4.2 million in inflows on Wednesday as the crypto market rallyrestarted. It was the seventh consecutive day of inflows, with the cumulative total rising to $1.26 billion.
Increased buying by American institutional investors in a time when the price is stuck in a tight range is a sign of accumulation, which often leads to a strong rebound.
You might also like: Is crypto coming to X Money? Elon Musk responds after first images appear
Another sign of accumulation is that $XRP outflows from exchanges are increasing. Data compiled by CryptoQuant shows that over 7 billion $XRP tokens exited exchanges in February. The total amount of $XRP tokens in exchanges has dropped to the lowest level in years.
A possible reason why investors are accumulating $XRP tokens is its strong fundamentals, including the ongoing Ripple USD growth. The stablecoin has accumulated over $1.5 billion in assets, with its daily volume soaring to over $1.5 billion.
RLUSD is benefiting from the rising demand from both retail and institutional investors, a trend that may continue after its integration on Ripple Prime.
$XRP price forecast: Technical analysis
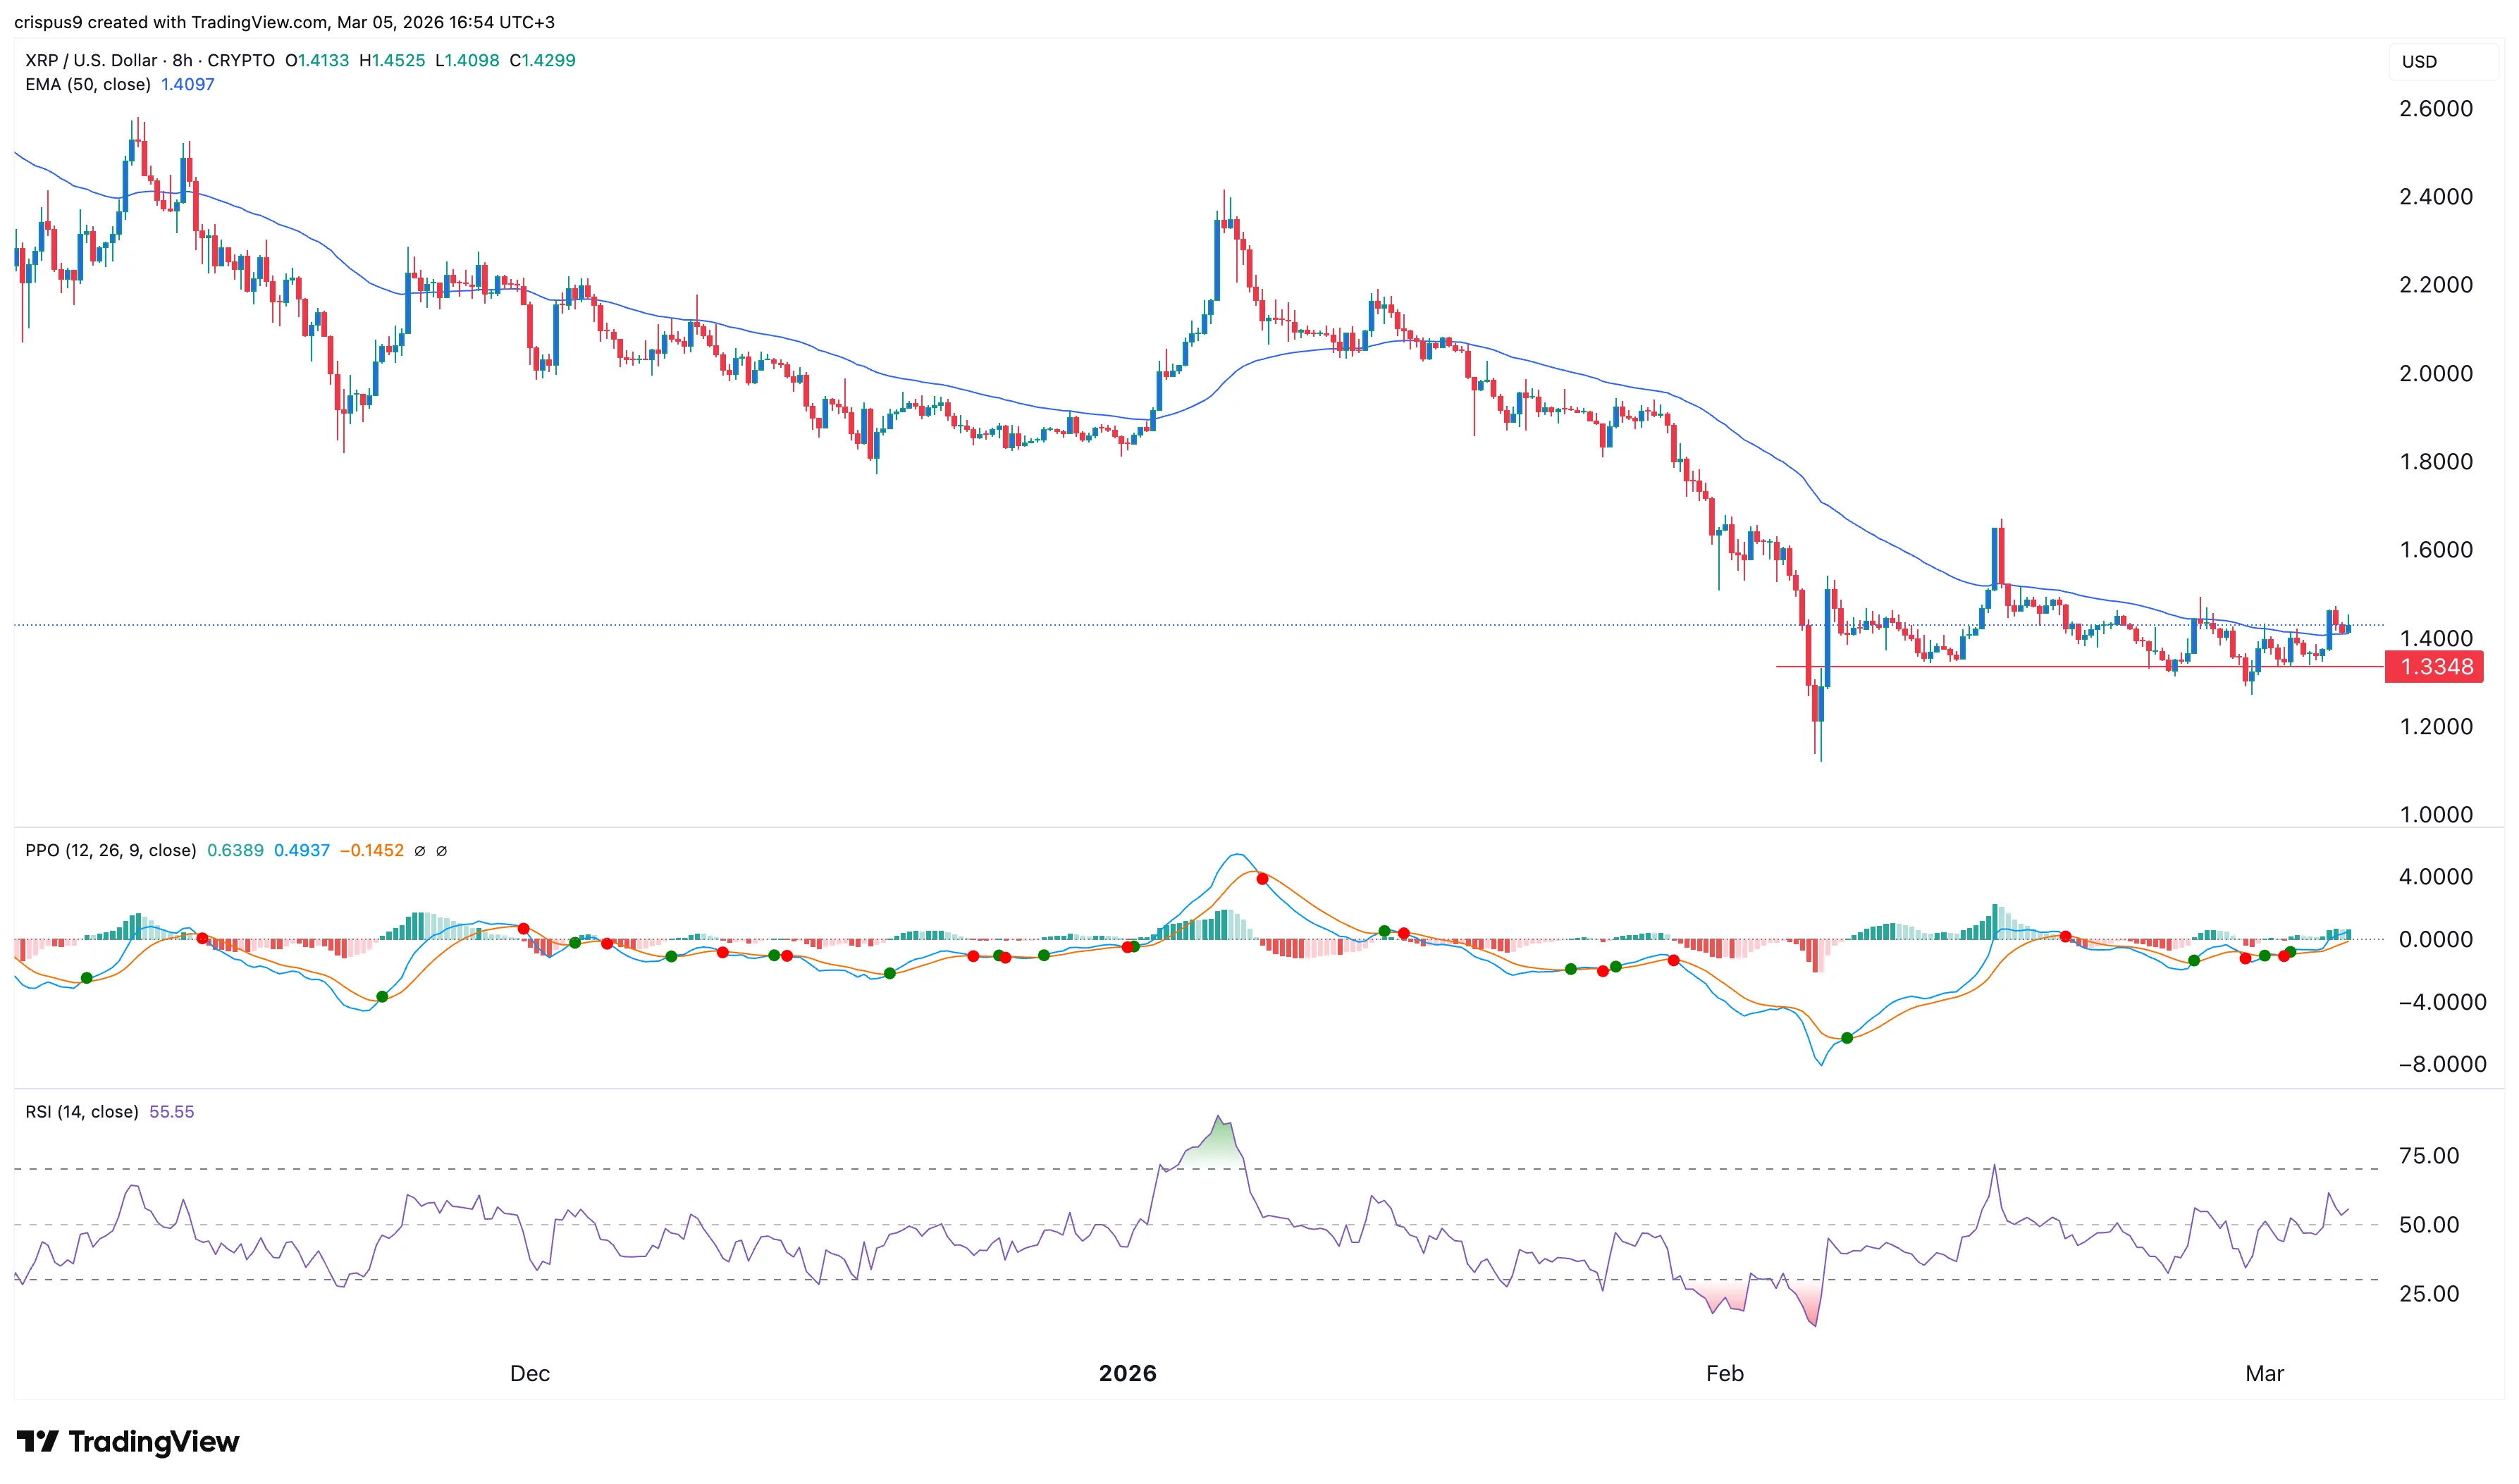
Ripple price chart | Source: crypto.news
The eight-hour chart shows that the $XRP price has remained in a narrow range in the past few weeks.
A closer look shows that it formed a double-bottom pattern at $1.3350 and a neckline at $1.6745. This pattern normally means that short-sellers are largely uncomfortable placing short trades below that level.
The coin has moved slightly above the 50-day Exponential Moving Average. Also, the Percentage Price Oscillator has crossed the zero line, while the Relative Strength Index has jumped above 50.
Therefore, the most likely $XRP price forecast is bullish, with the next key target being the neckline at $1.6638. The bullish view will become invalid if it drops below the key support level at $1.3350.
You might also like: ChangeNOW is settling crypto swaps in under a minute.

 Bitcoin
  Ethereum
  Tether
  BNB
BNB  USDC
USDC  XRP
XRP  Solana
  TRON
TRON  Figure Heloc
  Hyperliquid
  Dogecoin
  USDS
USDS  LEO Token
  Wrapped stETH
  Zcash
Zcash  WhiteBIT Coin
  Wrapped Bitcoin
  Cardano
  Binance Bridged USDT (BNB Smart Chain)
  Stellar
  Canton
  Wrapped eETH
  Bitcoin Cash
  sUSDS
sUSDS  USD1
USD1  Ethena USDe
  Coinbase Wrapped BTC
  Litecoin
  Global Dollar
  Circle USYC
  WETH
WETH  Hedera
  Sui
Sui  USDT0
USDT0  Avalanche
  Shiba Inu
  NEAR Protocol
  BlackRock USD Institutional Digital Liquidity Fund
  Ondo US Dollar Yield
  Ethena Staked USDe
  Bittensor
  World Liberty Financial
  PAX Gold
  MemeCore
  Aster
Aster  HTX DAO
  OKB
OKB  Ripple USD
  Ondo
Ondo  USDD
USDD  syrupUSDC
  Falcon USD
  Polkadot
  Aave
Aave  BFUSD
BFUSD  Worldcoin
  Sky
Sky  Pi Network
  Pepe
Pepe  Jupiter Perpetuals Liquidity Provider Token
  Spiko EU T-Bills Money Market Fund
  Quant
Quant  KuCoin
  Janus Henderson Anemoy Treasury Fund
  Jito Staked SOL
  USDGO
USDGO  Stable
  JUST
JUST  Binance-Peg WETH
  POL (ex-MATIC)
  Rocket Pool ETH
  Cosmos Hub
  Binance Bridged USDC (BNB Smart Chain)
  Render
  Algorand
  ADI
ADI  Function FBTC
  Beldex
  USDtb
USDtb  NEXO
NEXO  Jupiter
  LAB
LAB  syrupUSDT
  Spiko Amundi Overnight Swap Fund (EUR)
  币安人生 (BinanceLife)
  Gate
Gate  Binance Staked SOL
  Ethena
  Audiera
  Janus Henderson Anemoy AAA CLO Fund
  Filecoin
  Pump.fun
  NEW X CEO IS BACK
  Polygon Bridged USDC (Polygon PoS)
  Lighter
  Solv Protocol BTC
  Flare
Flare  Usual USD
  YLDS
YLDS  clBTC
clBTC  Midnight
  Aptos
Aptos  Aerodrome Finance
  Venice Token
  StakeWise Staked ETH
  TrueUSD
  Arbitrum
  Kinetiq Staked HYPE
  A7A5
A7A5  tBTC
tBTC  Injective
  EURC
EURC  VeChain
  Ondo Short-Term U.S. Government Bond Fund
  Pudgy Penguins
  c8ntinuum
  Hastra PRIME
  Mantle Staked Ether
  Official Trump
  Celestia
  Polygon PoS Bridged DAI (Polygon POS)
  Ether.fi
  Artificial Superintelligence Alliance
  COCA
COCA  Sun Token
  Bonk
Bonk  SPX6900
  Liquid Staked ETH
  Arbitrum Bridged WBTC (Arbitrum One)
  LayerZero
  Virtuals Protocol
  Pyth Network
  The9bit
  Terra Luna Classic
  Wrapped Flare
  Kinesis Gold
  L2 Standard Bridged WETH (Base)
  apxUSD
  Steakhouse USDC Morpho Vault
  Curve DAO
  Jito
Jito  Monad
Monad  Binance-Peg XRP
  Ether.Fi Liquid ETH
  Lido DAO
  MegaUSD
  Noon
Noon  AINFT
AINFT  Bitcoin SV
  Jupiter Staked SOL
  Savings USDD
  Olympus
  DoubleZero
  Plasma
  Marinade Staked SOL
  Legacy Frax Dollar