
 Bitcoin
  Ethereum
  Tether
  BNB
BNB  USDC
USDC  XRP
XRP  Solana
  TRON
TRON  Figure Heloc
  Hyperliquid
  Dogecoin
  USDS
USDS  LEO Token
  Wrapped stETH
  Zcash
Zcash  Cardano
  Wrapped Bitcoin
  Stellar
  Binance Bridged USDT (BNB Smart Chain)
  WhiteBIT Coin
  Canton
  Wrapped eETH
  LAB
LAB  Bitcoin Cash
  sUSDS
sUSDS  USD1
USD1  Coinbase Wrapped BTC
  Ethena USDe
  Litecoin
  Hedera
  WETH
WETH  Circle USYC
  Sui
Sui  Global Dollar
  USDT0
USDT0  Avalanche
  NEAR Protocol
  Shiba Inu
  BlackRock USD Institutional Digital Liquidity Fund
  Ethena Staked USDe
  Ondo US Dollar Yield
  Bittensor
  PAX Gold
  MemeCore
  World Liberty Financial
  Aster
Aster  OKB
OKB  HTX DAO
  Ondo
Ondo  Ripple USD
  syrupUSDC
  Worldcoin
  Polkadot
  Falcon USD
  USDD
USDD  Aave
Aave  Sky
Sky  BFUSD
BFUSD  Pi Network
  Pepe
Pepe  Jupiter Perpetuals Liquidity Provider Token
  KuCoin
  Spiko EU T-Bills Money Market Fund
  Quant
Quant  Jito Staked SOL
  USDGO
USDGO  Janus Henderson Anemoy Treasury Fund
  Stable
  Binance-Peg WETH
  Audiera
  Rocket Pool ETH
  Render
  Binance Bridged USDC (BNB Smart Chain)
  Jupiter
  Cosmos Hub
  Algorand
  Function FBTC
  JUST
JUST  POL (ex-MATIC)
  NEXO
NEXO  Ethena
  ADI
ADI  syrupUSDT
  USDtb
USDtb  币安人生 (BinanceLife)
  Gate
Gate  Binance Staked SOL
  Beldex
  Spiko Amundi Overnight Swap Fund (EUR)
  Janus Henderson Anemoy AAA CLO Fund
  Lighter
  Pump.fun
  Filecoin
  NEW X CEO IS BACK
  Polygon Bridged USDC (Polygon PoS)
  Flare
Flare  Solv Protocol BTC
  Midnight
  Venice Token
  clBTC
clBTC  Usual USD
  Aerodrome Finance
  YLDS
YLDS  Aptos
Aptos  Arbitrum
  StakeWise Staked ETH
  TrueUSD
  Kinetiq Staked HYPE
  Injective
  tBTC
tBTC  A7A5
A7A5  EURC
EURC  Bonk
Bonk  Pudgy Penguins
  Ondo Short-Term U.S. Government Bond Fund
  c8ntinuum
  VeChain
  Mantle Staked Ether
  Ether.fi
  Hastra PRIME
  Polygon PoS Bridged DAI (Polygon POS)
  Official Trump
  Artificial Superintelligence Alliance
  COCA
COCA  SPX6900
  Celestia
  Virtuals Protocol
  Liquid Staked ETH
  Jito
Jito  Arbitrum Bridged WBTC (Arbitrum One)
  Sun Token
  Terra Luna Classic
  The9bit
  Wrapped Flare
  apxUSD
  Curve DAO
  L2 Standard Bridged WETH (Base)
  Grass
Grass  Steakhouse USDC Morpho Vault
  Kinesis Gold
  Pyth Network
  ETHGas
  Bitcoin SV
  Binance-Peg XRP
  Plasma
  Ether.Fi Liquid ETH
  Noon
Noon  Unibase
  Monad
Monad  AINFT
AINFT  Jupiter Staked SOL
  Savings USDD
  Olympus
  LayerZero
  DoubleZero
  Marinade Staked SOL
The pioneer cryptocurrency Bitcoin remained silent on Saturday, March 4th, as its price traded around $67,000. Such low volatility trading is common over the weekend, as institutional investors from traditional markets are offline. However, the latest on-chain data indicate that Bitcoin’s network utilization has plunged to its level since recorded, which analysts predict as a potential signal for market bottoming. Is Bitcoin price ready to reclaim the $70,000 mark?
$BTC Network Usage Drops to Historic Lows as RVTS Ratio Peaks
The recent monitoring of the Bitcoin blockchain information has noted the 28-day ratio of RVTS to be the highest since its inception in tracking. The ratio of the market value of the cryptocurrency to its adjusted economic volume, the metric, is on the rise, which indicates a significant decline in the flow of value in the network nodes.
This trend translates to the least active time of ledger usage in the history of the asset. The reason behind this is the fact that the adjusted volume figures were significantly reduced, on which the calculation is based.
History of previous Bitcoin cycles indicates that the same ratio peaks were realized in and around the cycle troughs of 2012, 2015, 2019 and 2022. Similar indications were also evident in the local lows within long bull or bear complexes.
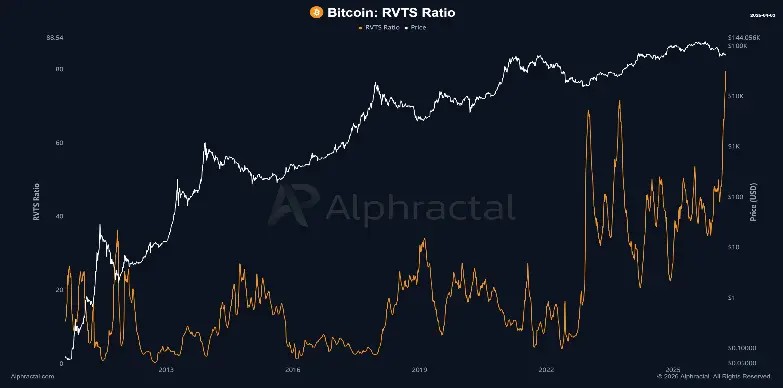
The phenomenon is observed in the context of a trading ecosystem that has been dominated by derivative markets and liquidity injection mechanisms, as opposed to the conventional base-layer movements. These volume changes have accordingly reduced network participation.
Bitcoin Price 6% short for challenging Major resistance
Over the past two months, the Bitcoin price showcased a slow yet steady recovery from $59,930 to current trading value of $67,410, registering a gain of 12.6%. Along with price action, the momentum indicator relative strength index (RSI) showed a surge to 45%, suggesting a slow down in correction momentum.
Despite the boost recorded in the daily RSI slope, the corresponding price action remains low, indicating failed attempts from buyers. Interestingly, the recent upswing in price is marked as a fresh bull cycle within the formation of a falling channel pattern in daily charts.
Since August 2025, the coin price has been resonating actively within two descending trendlines, which act as dynamic resistance and support against buyers. Currently trading at $67,270, Bitcoin price is just 5.3% away from challenging the residence trendline of the channel pattern. The potential retest could act as a pivot level to decide $BTC’s near term trajectory.
If the sellers continue to defend this dynamic resistance, the coin price could revert lower and head for nearby support at $62,500, followed by $57,500.
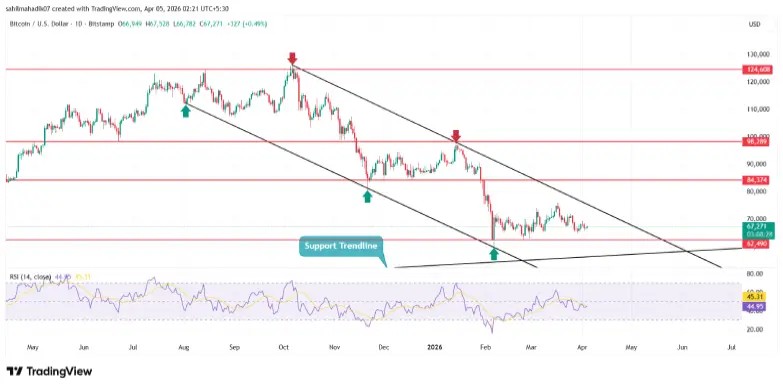
On the contrary, a bullish breakout from the pattern’s resistance trendline will renew the recovery momentum and push Bitcoin price above $70,000.