
 Bitcoin
  Ethereum
  Tether
  BNB
BNB  USDC
USDC  XRP
XRP  Solana
  TRON
TRON  Figure Heloc
  Hyperliquid
  Dogecoin
  USDS
USDS  LEO Token
  Wrapped stETH
  Zcash
Zcash  Stellar
  Wrapped Bitcoin
  WhiteBIT Coin
  Binance Bridged USDT (BNB Smart Chain)
  Cardano
  Canton
  Wrapped eETH
  USD1
USD1  sUSDS
sUSDS  Ethena USDe
  Bitcoin Cash
  Coinbase Wrapped BTC
  LAB
LAB  Litecoin
  Hedera
  WETH
WETH  Circle USYC
  Global Dollar
  Sui
Sui  USDT0
USDT0  Avalanche
  Shiba Inu
  NEAR Protocol
  BlackRock USD Institutional Digital Liquidity Fund
  Ethena Staked USDe
  MemeCore
  Ondo US Dollar Yield
  Bittensor
  PAX Gold
  World Liberty Financial
  Aster
Aster  OKB
OKB  Ripple USD
  Ondo
Ondo  HTX DAO
  syrupUSDC
  Polkadot
  Falcon USD
  Worldcoin
  USDD
USDD  Sky
Sky  Aave
Aave  BFUSD
BFUSD  Pi Network
  Jupiter Perpetuals Liquidity Provider Token
  Pepe
Pepe  KuCoin
  Quant
Quant  Spiko EU T-Bills Money Market Fund
  Jito Staked SOL
  Audiera
  USDGO
USDGO  Janus Henderson Anemoy Treasury Fund
  Binance-Peg WETH
  Stable
  Rocket Pool ETH
  Jupiter
  Binance Bridged USDC (BNB Smart Chain)
  Render
  Cosmos Hub
  POL (ex-MATIC)
  Function FBTC
  NEXO
NEXO  Algorand
  JUST
JUST  USDtb
USDtb  Gate
Gate  syrupUSDT
  Ethena
  ADI
ADI  Beldex
  Binance Staked SOL
  Janus Henderson Anemoy AAA CLO Fund
  币安人生 (BinanceLife)
  Spiko Amundi Overnight Swap Fund (EUR)
  Venice Token
  Pump.fun
  Filecoin
  NEW X CEO IS BACK
  Polygon Bridged USDC (Polygon PoS)
  Solv Protocol BTC
  Flare
Flare  YLDS
YLDS  Usual USD
  clBTC
clBTC  Midnight
  Lighter
  Aptos
Aptos  Arbitrum
  TrueUSD
  StakeWise Staked ETH
  A7A5
A7A5  Aerodrome Finance
  Kinetiq Staked HYPE
  tBTC
tBTC  Injective
  EURC
EURC  Artificial Superintelligence Alliance
  Ondo Short-Term U.S. Government Bond Fund
  Official Trump
  c8ntinuum
  VeChain
  Mantle Staked Ether
  Hastra PRIME
  Pudgy Penguins
  Polygon PoS Bridged DAI (Polygon POS)
  Bonk
Bonk  Jito
Jito  COCA
COCA  Virtuals Protocol
  Terra Luna Classic
  Liquid Staked ETH
  Celestia
  Arbitrum Bridged WBTC (Arbitrum One)
  SPX6900
  apxUSD
  Grass
Grass  The9bit
  Wrapped Flare
  Sun Token
  Kinesis Gold
  L2 Standard Bridged WETH (Base)
  Curve DAO
  Steakhouse USDC Morpho Vault
  Ether.fi
  Pyth Network
  Bitcoin SV
  Binance-Peg XRP
  ETHGas
  Ether.Fi Liquid ETH
  AINFT
AINFT  Noon
Noon  BUILDon
  Plasma
  Jupiter Staked SOL
  Olympus
  Savings USDD
  Monad
Monad  Legacy Frax Dollar
  Unibase
  Marinade Staked SOL
$XRP is approaching one of its most closely watched technical levels after months of steady weakness pushed the token into a broad corrective structure. While the price has yet to confirm a reversal, several market analysts believe downside momentum may be slowing as $XRP trades near long-term support.
Notably, the latest chart studies focus on different indicators, but they reach a similar conclusion. Price continues to test a critical area where previous market cycles found support, while momentum indicators are beginning to resemble conditions seen before earlier recoveries. Even so, analysts stress that confirmation still depends on $XRP reclaiming key resistance levels.
Analysts Focus on Long-Term Support Zone
Analyst Rachel Crypto shared a long-term chart showing $XRP trading inside a descending corrective channel following the completion of its previous impulsive advance.
According to the chart, the correction has gradually pushed the price into what is labeled as a “3D Fair Value Gap Box,” a zone that coincides with historical demand. The analysis suggests $XRP could be entering the final portion of its corrective cycle if buyers continue defending this support.
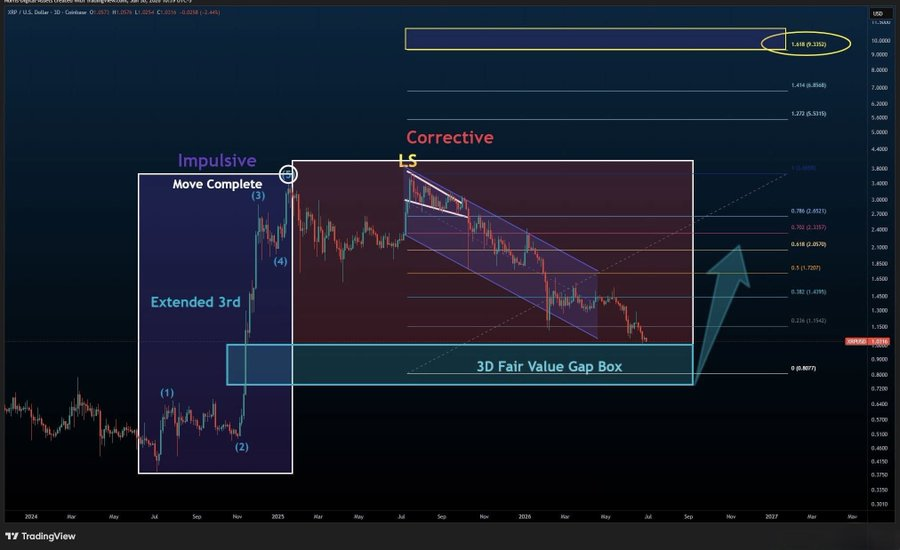
The projected path on the chart remains conditional rather than guaranteed. It shows a possible recovery beginning from current levels before targeting higher Fibonacci retracement zones over time.
Instead of predicting an immediate rally, the analysis argues that patience remains important while $XRP continues building support inside the lower section of the channel.
Related: Chainlink Price Prediction July 2026: Can Fidelity’s $20M Integration Finally Move LINK Off Its Lows
$1.65 Remains the Key Technical Level
EGRAG Crypto highlighted $1.65 as the most important price level on the monthly timeframe.The analyst noted that $XRP recently opened below the 50-period simple moving average, placing attention on whether buyers can reclaim that indicator before the monthly close.
Historically, $XRP has often tested its longer-term 88-period moving average before beginning larger expansion phases.
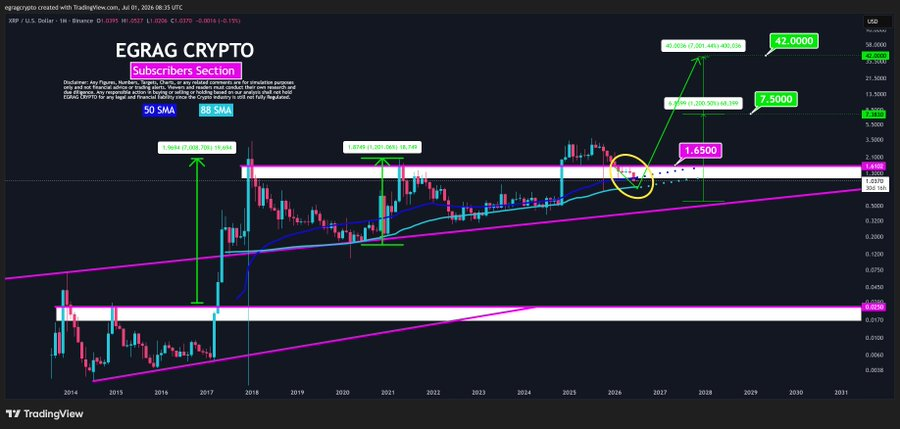
Based on previous market cycles, EGRAG outlined several possible outcomes. The analyst assigned the highest probability to $XRP revisiting the 88 SMA before any sustained breakout, although a faster recovery above the 50 SMA would improve the bullish outlook.
Above all, the analysis identifies $1.65 as the trigger level. Holding above that area would preserve the broader structure, while a confirmed move through long-term resistance would strengthen the case for higher targets in later phases of the cycle.
Related: Shiba Inu Price Prediction July 2026: Will SHIB’s Channel Squeeze Resolve Up or Down in July?
Monthly RSI Adds to Recovery Expectations
Another chart shared by Ripple shows $XRP forming a long-term symmetrical triangle, while the monthly Relative Strength Index continues to move toward the lower end of its historical range.
Previous major market bottoms developed after the RSI reached similar levels before turning higher. Although the current reading has not yet produced a confirmed reversal, the indicator suggests selling pressure has eased compared with earlier stages of the correction.
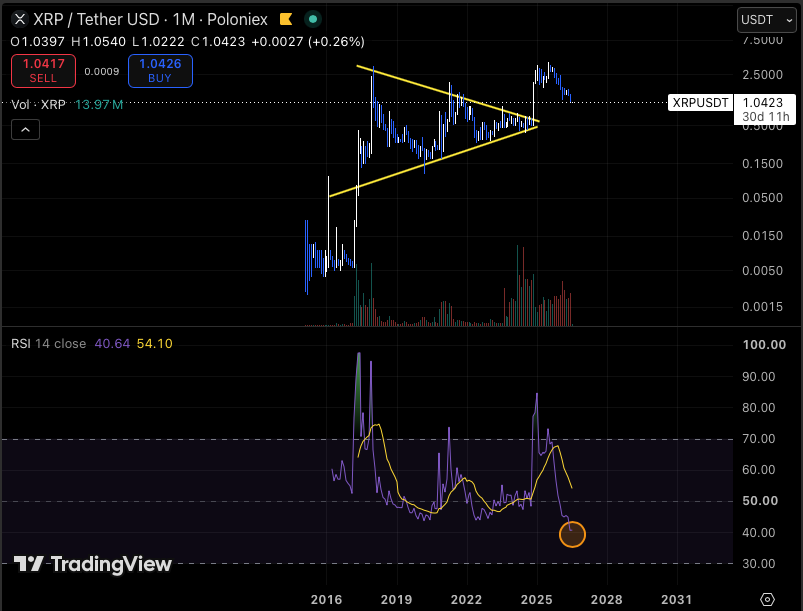
Meanwhile, the price structure continues to tighten within the multi-year triangle. Such formations often precede larger directional moves once the price breaks beyond either boundary.
For now, the technical picture remains balanced. Long-term support continues attracting attention, momentum indicators are showing early signs of stabilization, and analysts remain focused on whether $XRP can reclaim resistance levels before confirming that the broader correction has ended.