
 Bitcoin
  Ethereum
  Tether
  BNB
BNB  USDC
USDC  XRP
XRP  Solana
  TRON
TRON  Figure Heloc
  Hyperliquid
  Dogecoin
  USDS
USDS  LEO Token
  Wrapped stETH
  Zcash
Zcash  WhiteBIT Coin
  Wrapped Bitcoin
  Cardano
  Binance Bridged USDT (BNB Smart Chain)
  Stellar
  Canton
  Wrapped eETH
  Bitcoin Cash
  USD1
USD1  sUSDS
sUSDS  Ethena USDe
  Coinbase Wrapped BTC
  Litecoin
  Global Dollar
  Circle USYC
  WETH
WETH  Hedera
  Sui
Sui  Avalanche
  USDT0
USDT0  NEAR Protocol
  Shiba Inu
  BlackRock USD Institutional Digital Liquidity Fund
  Ondo US Dollar Yield
  Ethena Staked USDe
  Bittensor
  LAB
LAB  PAX Gold
  World Liberty Financial
  MemeCore
  HTX DAO
  Aster
Aster  OKB
OKB  Ondo
Ondo  Ripple USD
  syrupUSDC
  USDD
USDD  Polkadot
  Falcon USD
  Aave
Aave  Worldcoin
  BFUSD
BFUSD  Sky
Sky  Pi Network
  Pepe
Pepe  Jupiter Perpetuals Liquidity Provider Token
  Spiko EU T-Bills Money Market Fund
  Quant
Quant  KuCoin
  Jito Staked SOL
  Janus Henderson Anemoy Treasury Fund
  USDGO
USDGO  Stable
  Binance-Peg WETH
  POL (ex-MATIC)
  Rocket Pool ETH
  Cosmos Hub
  Render
  Binance Bridged USDC (BNB Smart Chain)
  JUST
JUST  Jupiter
  Function FBTC
  Algorand
  Audiera
  NEXO
NEXO  ADI
ADI  USDtb
USDtb  syrupUSDT
  Ethena
  Gate
Gate  Spiko Amundi Overnight Swap Fund (EUR)
  Binance Staked SOL
  币安人生 (BinanceLife)
  Beldex
  Janus Henderson Anemoy AAA CLO Fund
  Pump.fun
  Filecoin
  Lighter
  NEW X CEO IS BACK
  Polygon Bridged USDC (Polygon PoS)
  Solv Protocol BTC
  Flare
Flare  Midnight
  Usual USD
  YLDS
YLDS  clBTC
clBTC  Aerodrome Finance
  Aptos
Aptos  Venice Token
  StakeWise Staked ETH
  TrueUSD
  A7A5
A7A5  Kinetiq Staked HYPE
  Arbitrum
  tBTC
tBTC  Injective
  EURC
EURC  VeChain
  Pudgy Penguins
  Ondo Short-Term U.S. Government Bond Fund
  c8ntinuum
  Official Trump
  Mantle Staked Ether
  Ether.fi
  Hastra PRIME
  Polygon PoS Bridged DAI (Polygon POS)
  Artificial Superintelligence Alliance
  Bonk
Bonk  COCA
COCA  Jito
Jito  Sun Token
  Celestia
  Liquid Staked ETH
  SPX6900
  Arbitrum Bridged WBTC (Arbitrum One)
  Virtuals Protocol
  Terra Luna Classic
  The9bit
  Pyth Network
  Wrapped Flare
  LayerZero
  L2 Standard Bridged WETH (Base)
  apxUSD
  Steakhouse USDC Morpho Vault
  Curve DAO
  Kinesis Gold
  Monad
Monad  Binance-Peg XRP
  Bitcoin SV
  Ether.Fi Liquid ETH
  Noon
Noon  AINFT
AINFT  Lido DAO
  Grass
Grass  Jupiter Staked SOL
  Olympus
  Savings USDD
  Plasma
  MegaUSD
  Marinade Staked SOL
  DoubleZero
Ethereum remains under pressure as price action continues to reflect a broader bearish structure on the 4-hour chart. Although $ETH has stabilized near the $1,950 to $2,000 range, the recovery lacks conviction.
Sellers still control the trend, and momentum indicators show limited strength. Consequently, traders now focus on whether this consolidation marks a base or simply a pause before another leg lower.
Bearish Structure Keeps Pressure on Price
Ethereum peaked near $3,400 before entering a sustained decline marked by lower highs and lower lows. The breakdown below $2,600 accelerated downside momentum and pushed price toward the $1,746 macro support. That level, aligned with the 0 Fibonacci mark, triggered a relief bounce.
However, $ETH continues to trade below the 20, 50, 100, and 200 EMAs. This alignment confirms that sellers still dominate the broader structure.
Moreover, the $2,020 to $2,030 zone now acts as immediate resistance due to the EMA cluster. Price must reclaim this region to shift short-term momentum.
Above that, $2,137 represents the first key Fibonacci retracement barrier. A decisive move beyond this level could strengthen bullish sentiment.
However, the $2,380 area remains the critical structural ceiling. Only a sustained break above that level would confirm a more durable recovery phase.
On the downside, $ETH consolidates around the $1,950 to $1,960 range. Additionally, the $1,913 level aligns with the lower Bollinger Band and provides dynamic support.
If this floor fails, price could revisit the $1,746 swing low. A breakdown below that support would likely expose the $1,650 to $1,700 region. Hence, bulls must defend current levels to prevent renewed selling pressure.
Derivatives and Spot Flows Signal Caution
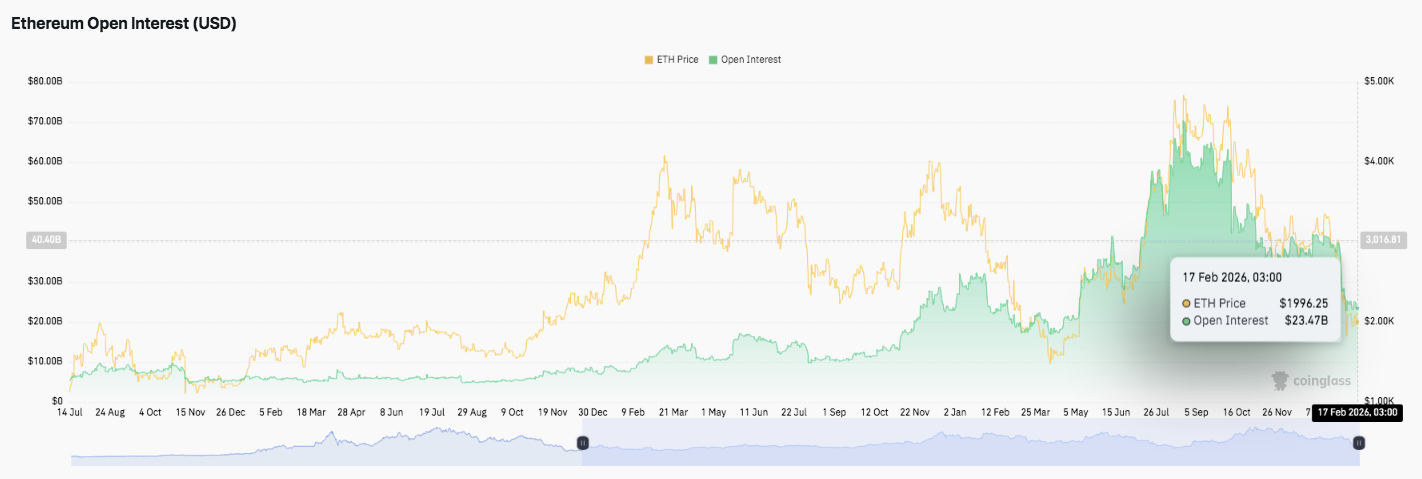
Open interest data reflects a clear cycle of expansion and contraction. During previous rallies, positioning surged and peaked above $60 billion. That buildup preceded a sharp unwind as price corrected. Recently, open interest stabilized near the mid-$20 billion range. This shift indicates lower leverage and more cautious participation in the derivatives market.
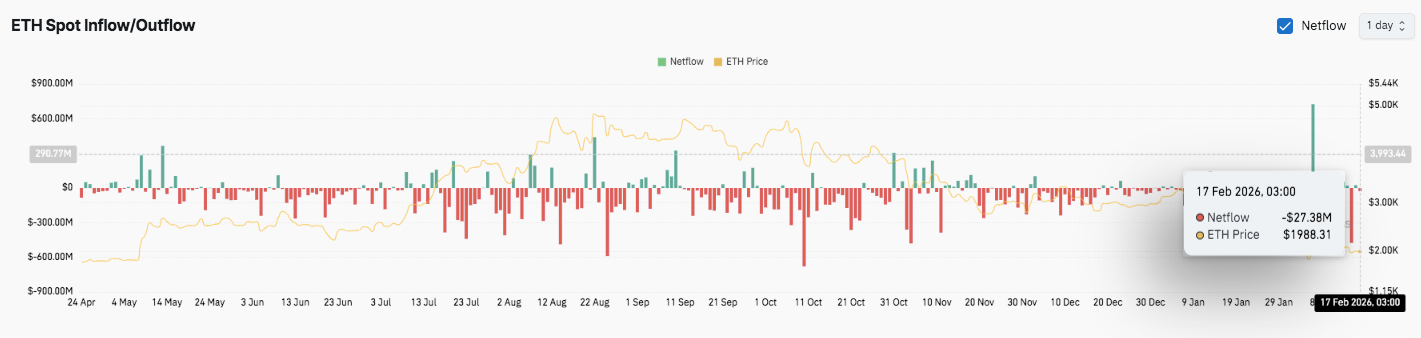
Significantly, spot flow data shows a prolonged period of net outflows stretching from late summer into early winter. Repeated large withdrawals reinforced persistent selling pressure.
However, February introduced a sharp inflow spike exceeding $600 million.
This development suggests renewed accumulation interest. If follow-through inflows continue, Ethereum could build a more stable foundation. Until then, resistance levels remain the key hurdle for any sustained upside recovery.
Technical Outlook for Ethereum ($ETH) Price
Key levels remain clearly defined as Ethereum consolidates after a sharp correction. Price continues to trade below major moving averages, keeping the broader structure cautious. However, short-term compression suggests a decisive move may approach.
Upside levels: $2,020–$2,030 serves as immediate resistance at the 20 and 50 EMA cluster. A sustained break above this zone could open the path toward $2,137 (0.236 Fib). Beyond that, $2,380 (0.382 Fib) stands as the first strong structural barrier. If bullish momentum strengthens, extension targets sit at $2,576 (0.5 Fib) and $2,772 (0.618 Fib), where medium-term trend reversal potential increases.
Downside levels: $1,950–$1,960 acts as the current consolidation floor. Below that, $1,913 aligns with the lower Bollinger Band dynamic support. A failure to defend this level exposes $1,746, the major swing low and Fib 0 base. A breakdown under $1,746 could accelerate losses toward $1,700 and potentially $1,650.
Resistance ceiling: The $2,380 region remains the key level to flip for medium-term bullish momentum. Until price reclaims this area, rallies may remain corrective within a broader downtrend.
Technically, Ethereum appears to be stabilizing after a steep decline from the $3,400 peak. The structure resembles a consolidation phase beneath descending resistance, where volatility compression often precedes expansion. Additionally, open interest has cooled significantly from prior highs, indicating reduced leverage risk. This reset could support a healthier base if spot inflows continue.
Will Ethereum Go Up?
Ethereum’s near-term direction depends on whether buyers can defend $1,913 and build momentum toward $2,137. Strong inflows and reclaiming the EMA cluster would strengthen recovery prospects.
However, failure to hold the $1,913–$1,950 zone risks renewed selling pressure. For now, $ETH remains in a pivotal range where confirmation, not speculation, will determine the next major move.
Disclaimer: The information presented in this article is for informational and educational purposes only. The article does not constitute financial advice or advice of any kind. Coin Edition is not responsible for any losses incurred as a result of the utilization of content, products, or services mentioned. Readers are advised to exercise caution before taking any action related to the company.